Source – preclinical manual of conservative dentistry ( V. Gopi Krishna)
Source – preclinical manual of conservative dentistry ( V. Gopi Krishna)
What is the rubber dam?

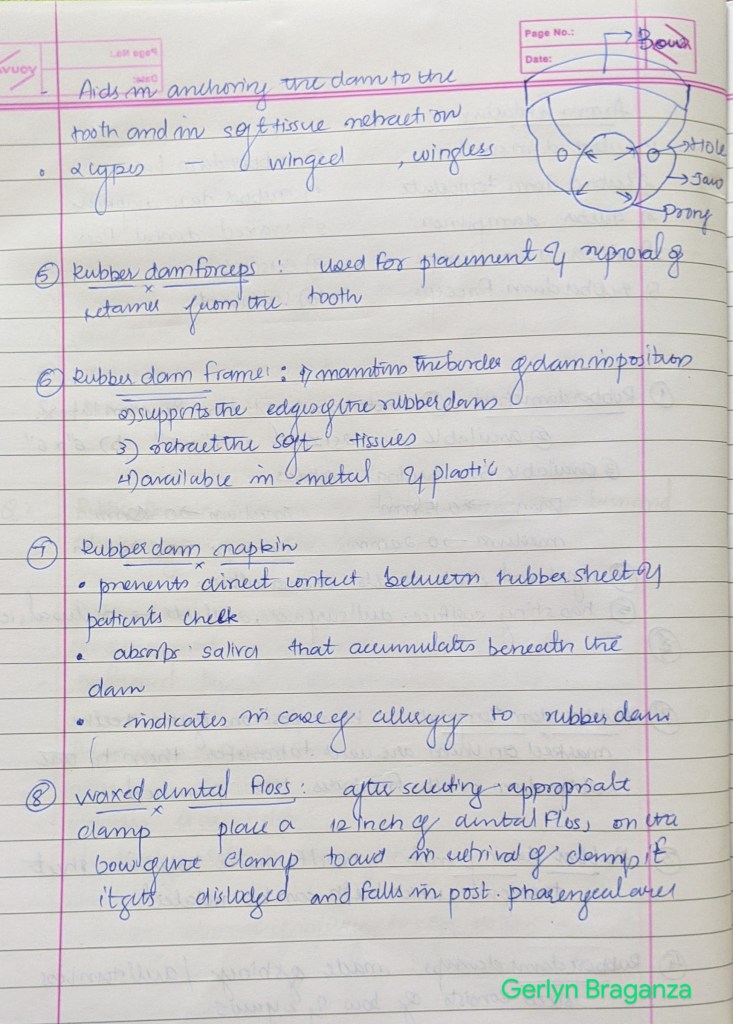
ARMAMENTARIUM


Source – Sturdevant’s art and science operative dentistry
Increase in the size of the organ or tissue due to increase in the size of the cells
WHAT CAUSES HYPERTROPHY?
Due to increase in the functional demand/workload
1.PHYSIOLOGICAL
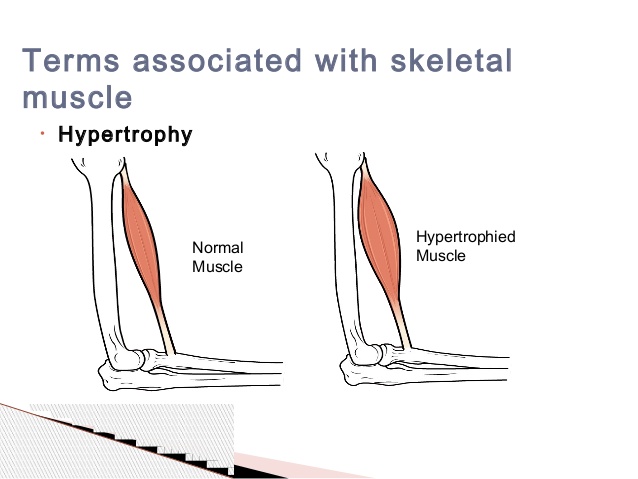
PATHOLOGICAL
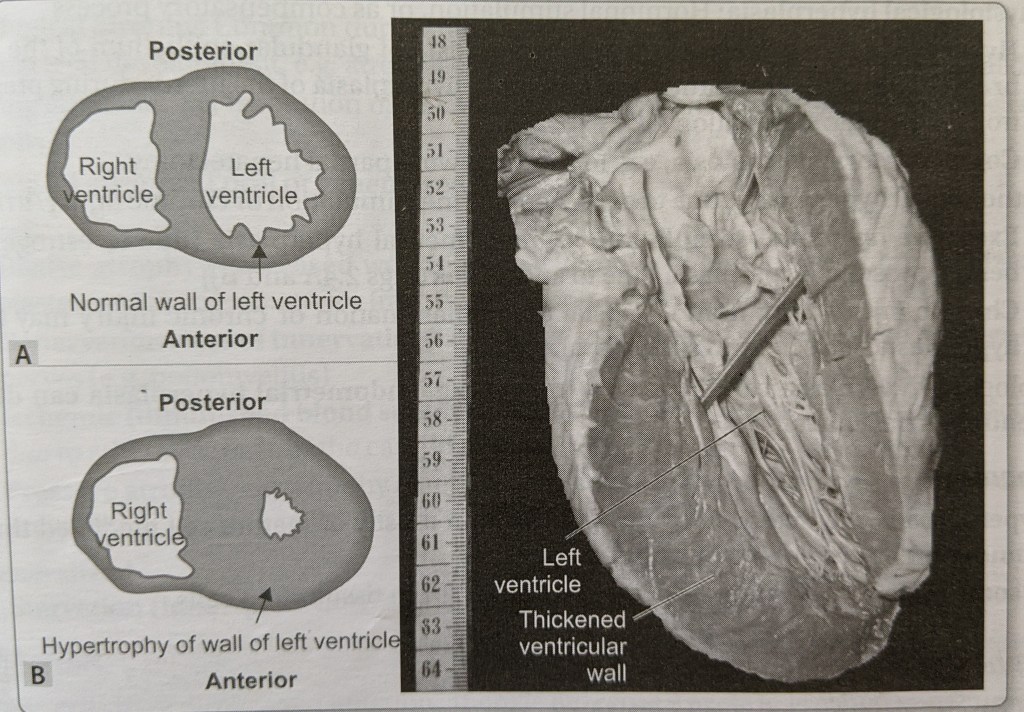

Mechanism of hypertrophy –
It occurs due to synthesis of the cellular proteins .
Mechanism involved in the hypertrophy of cardiac muscle-
Physiological hypertrophy– Due to increase in the workload causes mechanical stretch of the myocardium.
Pathological hypertrophy– due to to growth factors and hypertrophy agonists-
1. Growth factors – TGF – beta, insulin growth factor ( IGF -1) , Fibroblast growth factor (FGF)
2. Hypertrophy agonists- alpha-adrenergic agonists , endothelin-I , angiotensin -II , Nitric oxide (NO) and bradykinin
Source – Harshmohan ( textbook of pathology) and Ramdas Nayak

Source – sturdevant’s art and science of operative dentistry

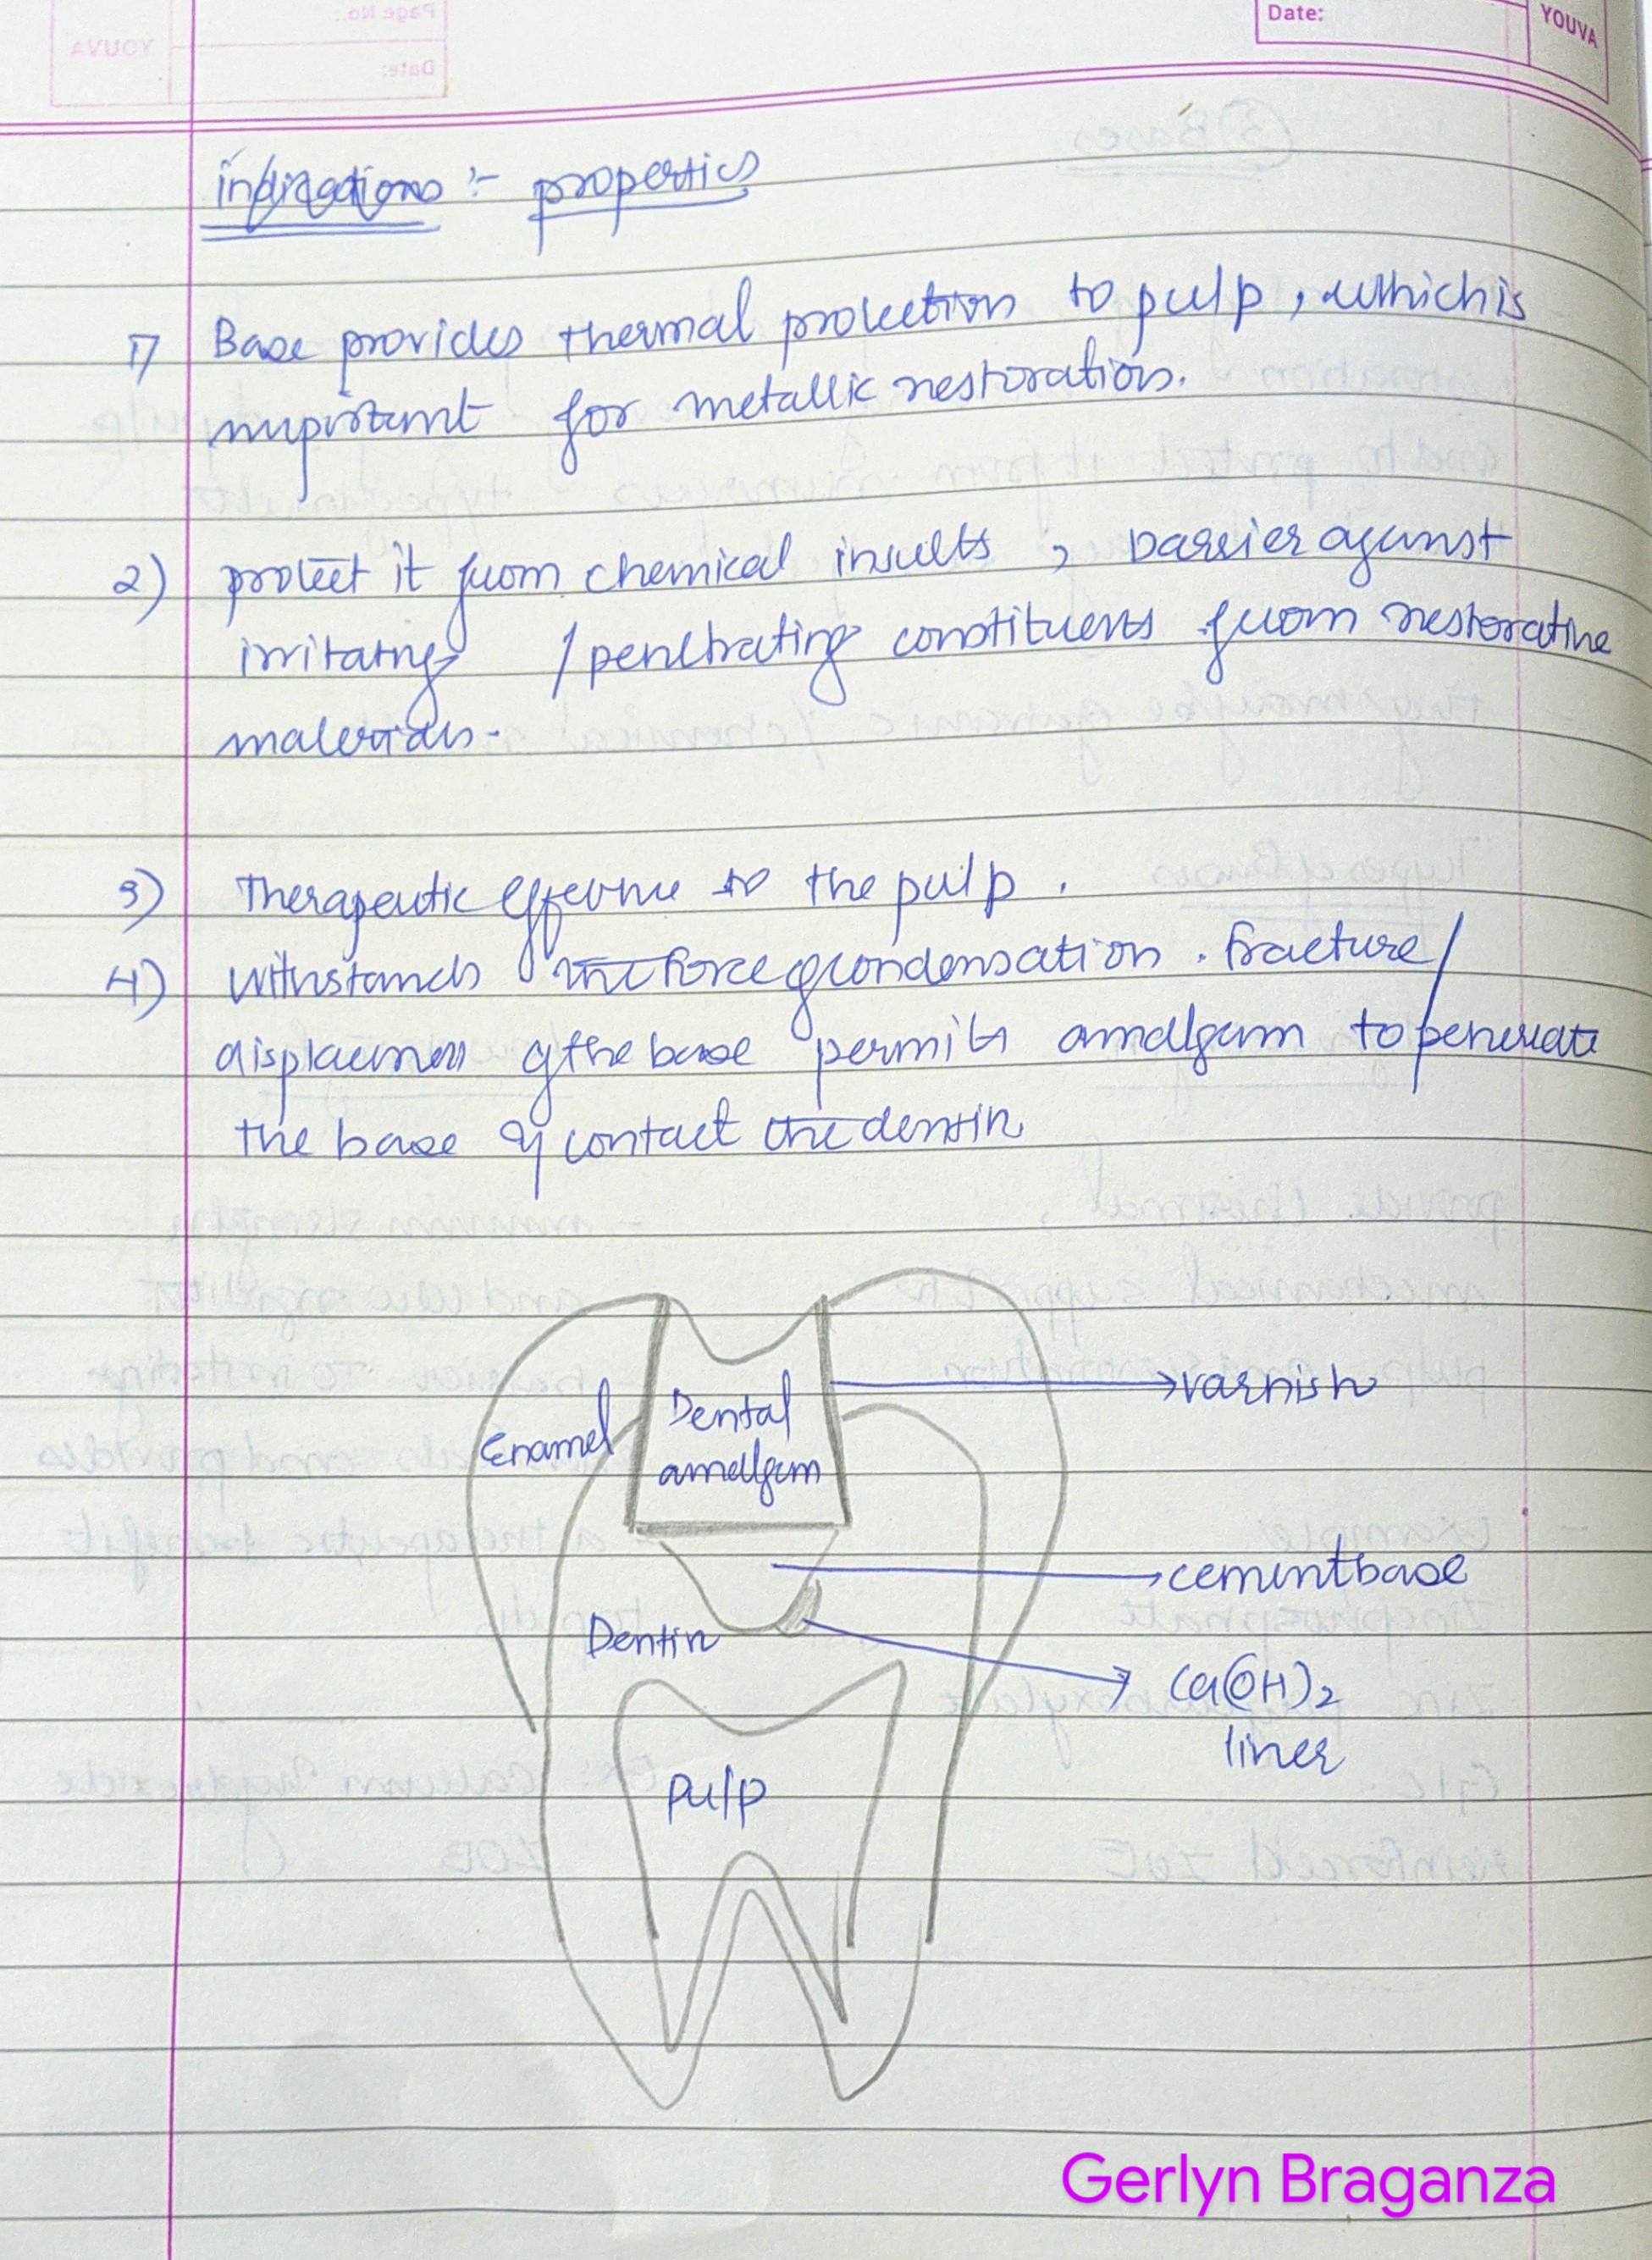
Source – Sturdevant’s art and science of operative dentistry and philips book of dental materials
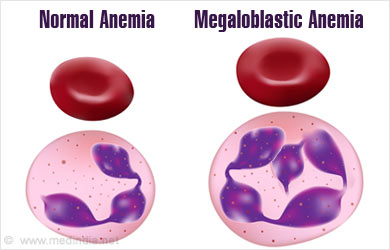
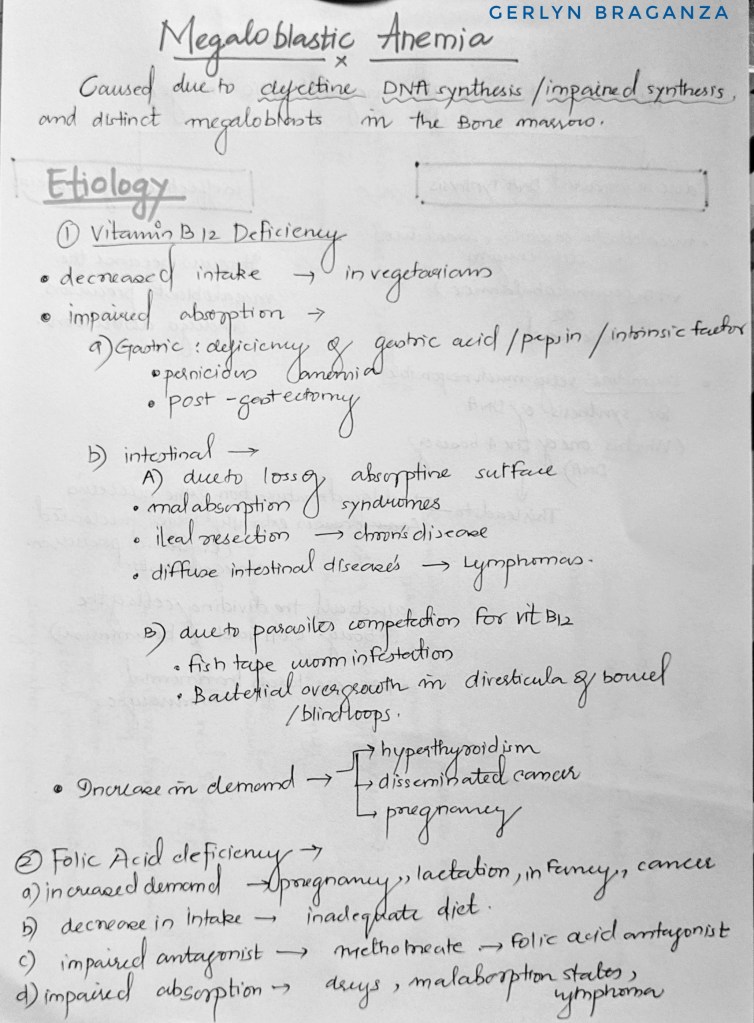
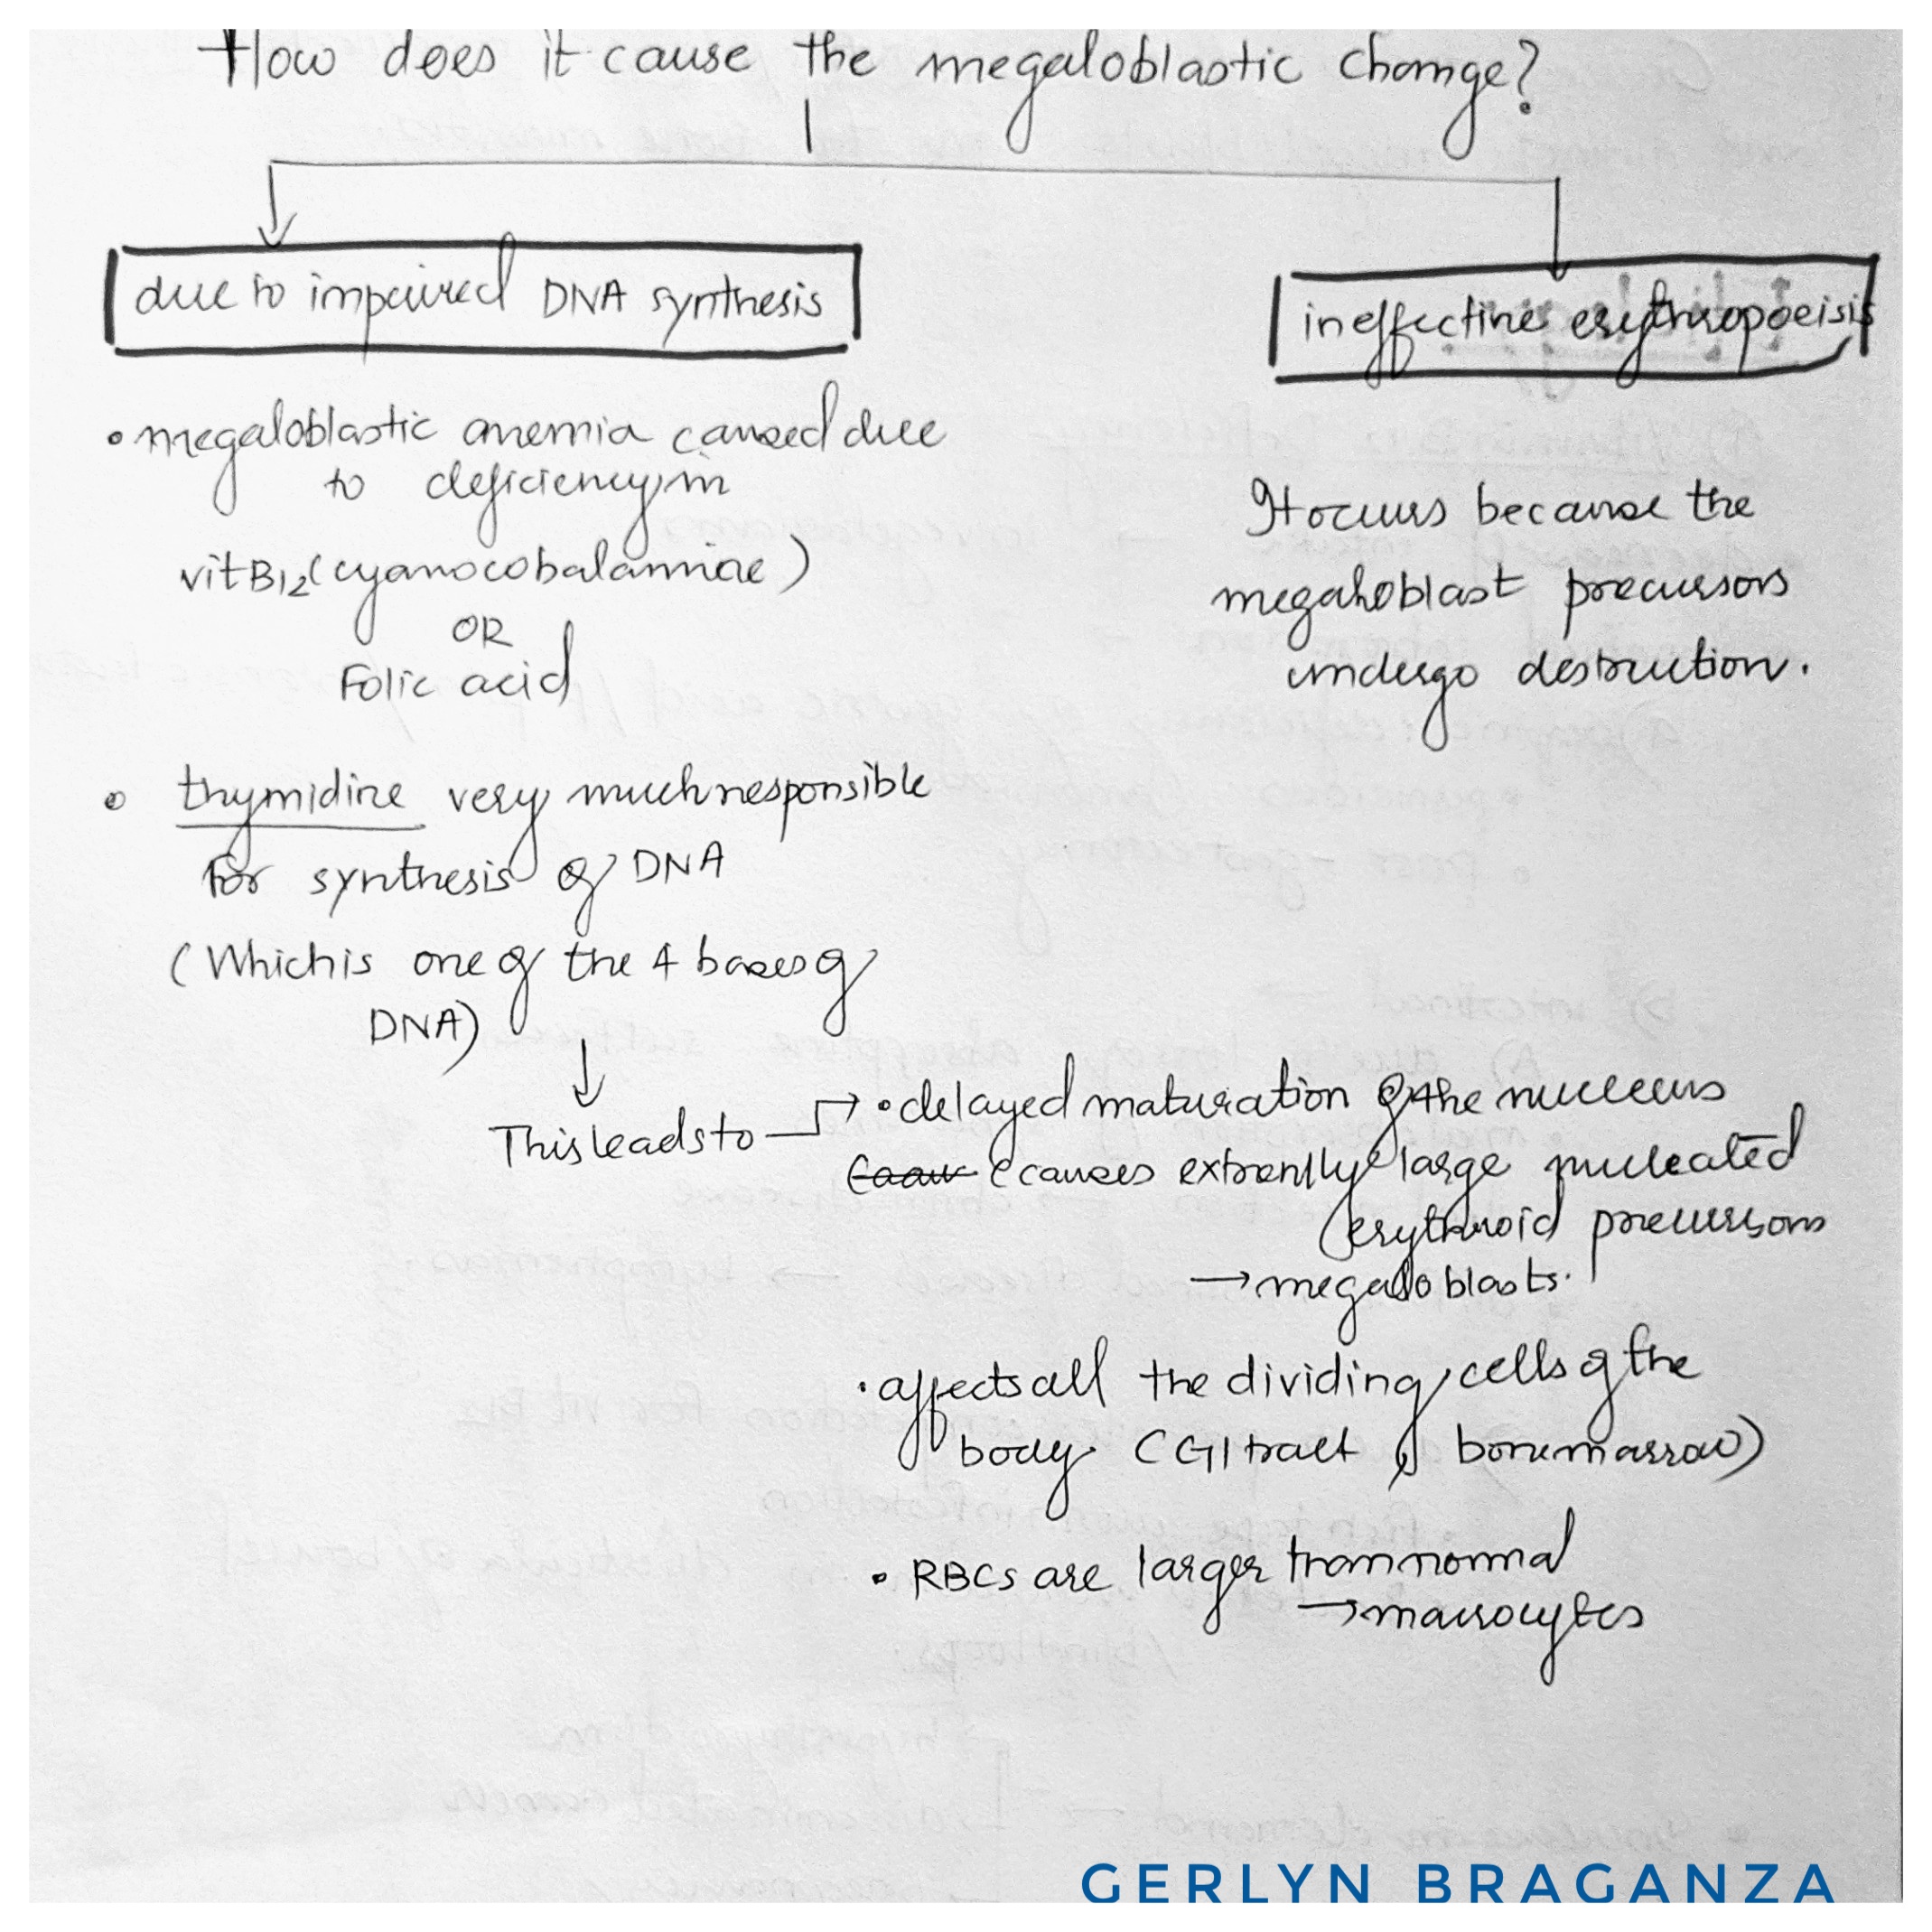
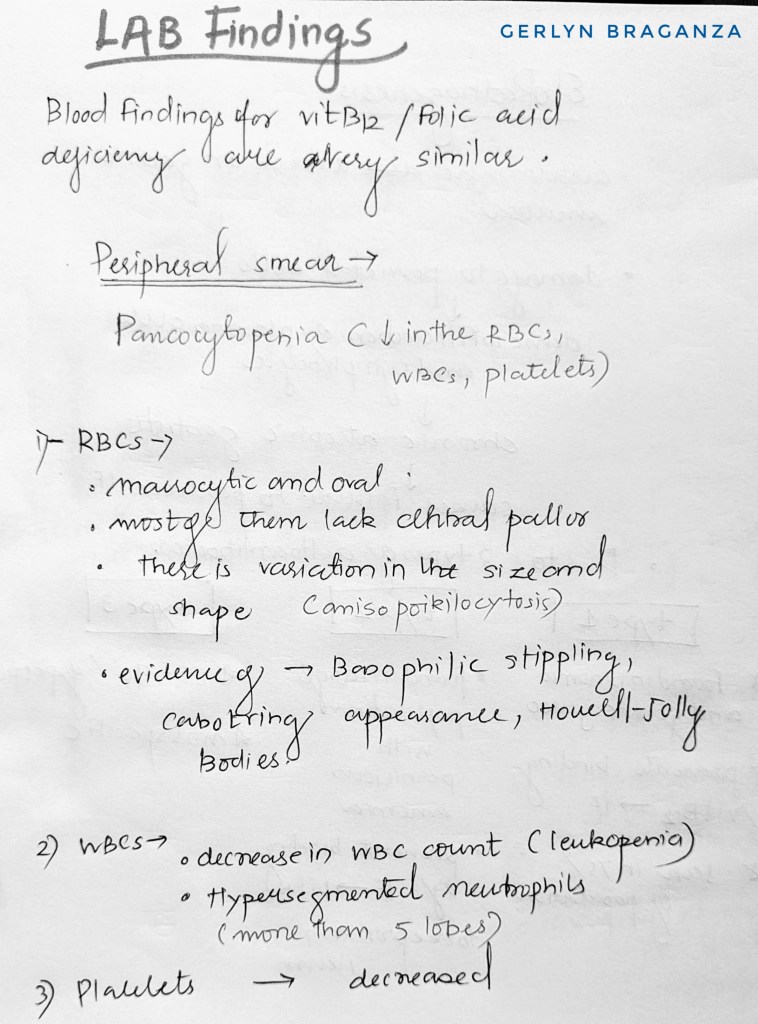
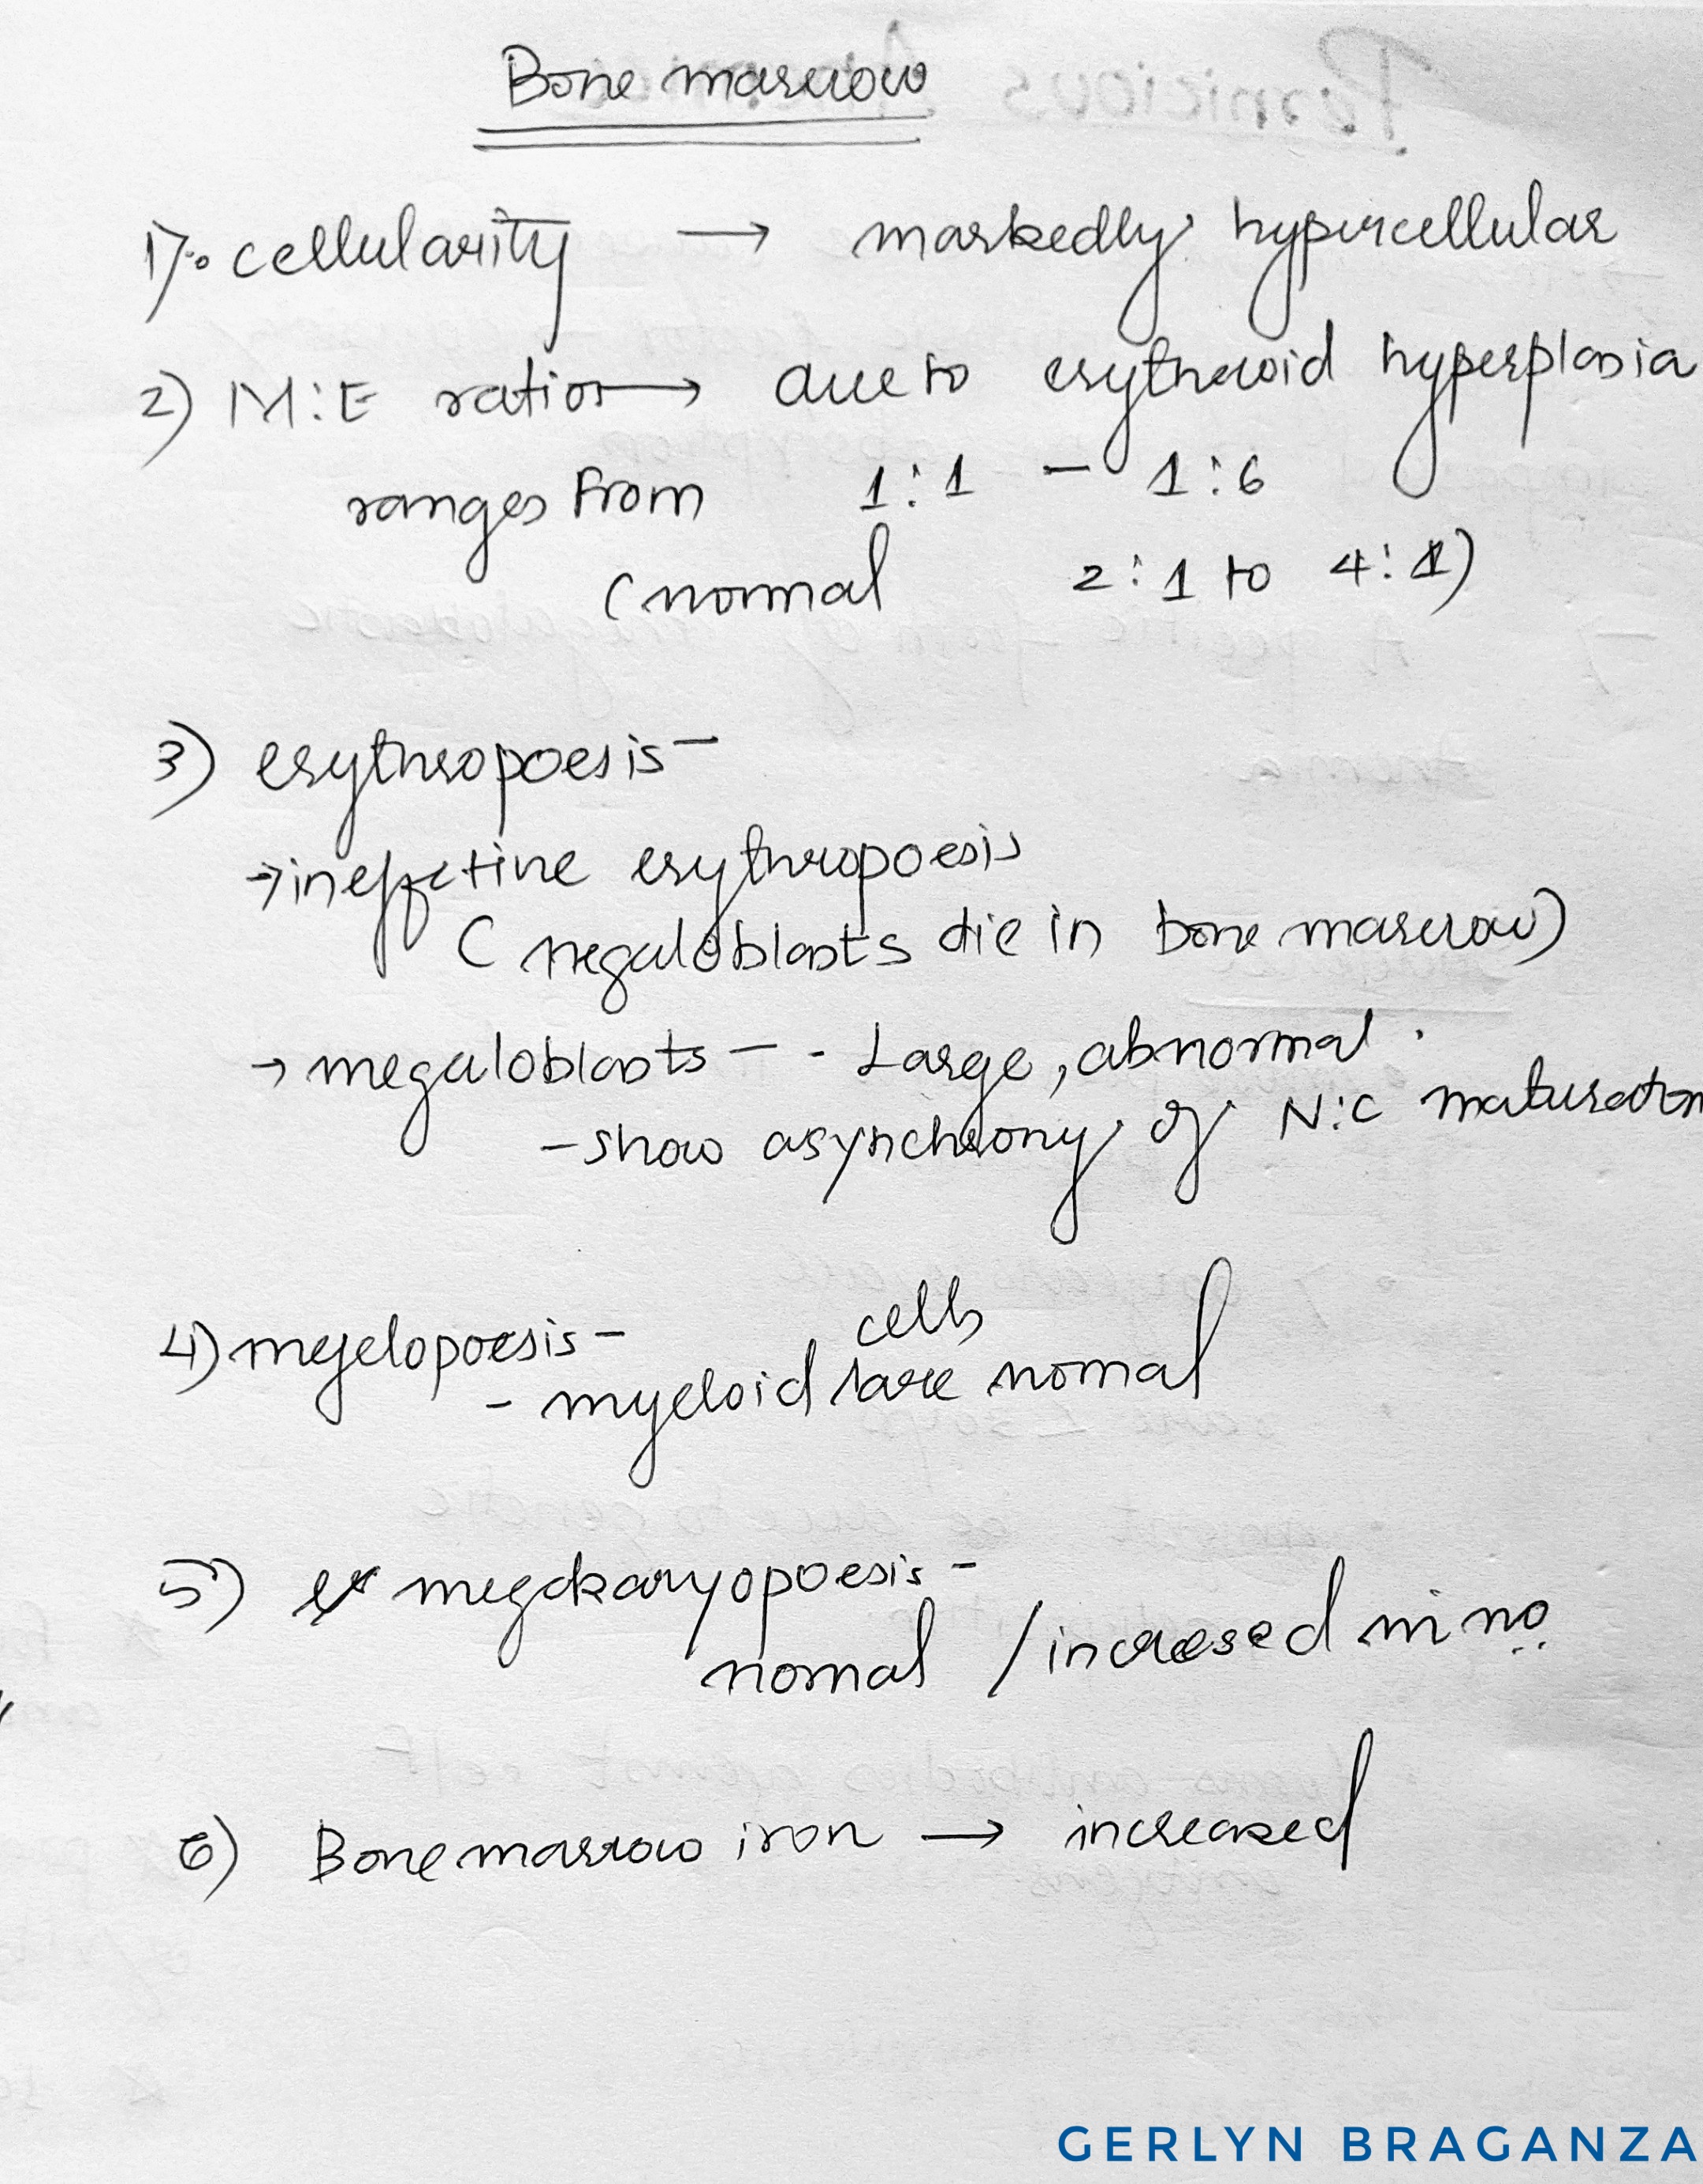
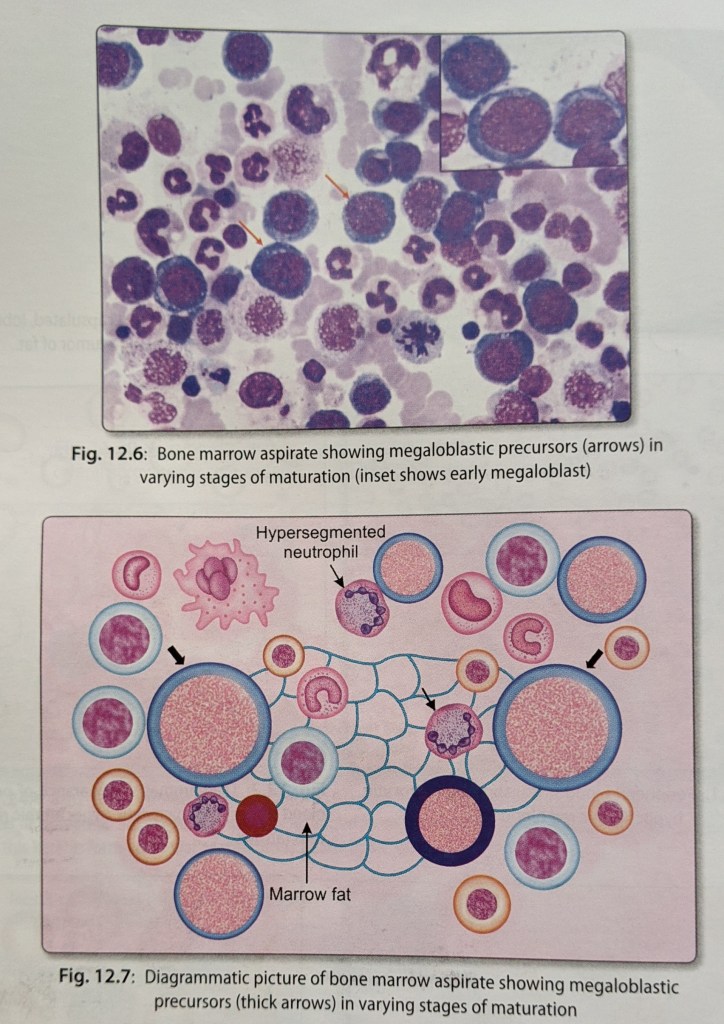
What is pernicious anemia ?
ETIOPATHOGENESIS
COMMON CHANGES SEEN IN BODY –

Source -google
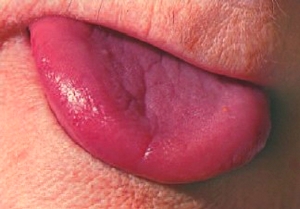
CLINICAL FINDINGS

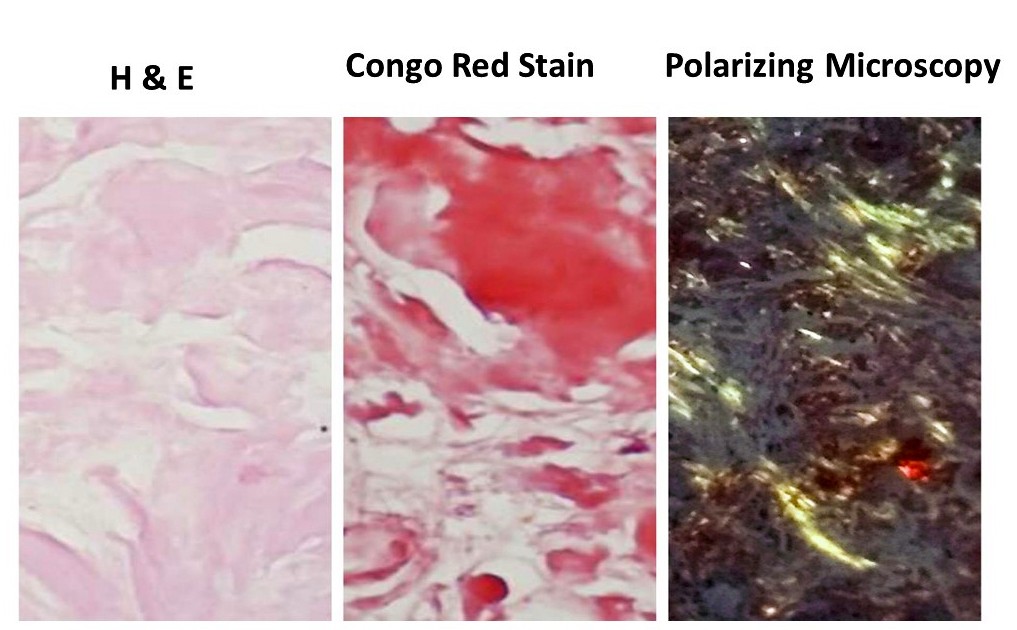
Source – textbook of pathology for dental students – Ramdas Nayak
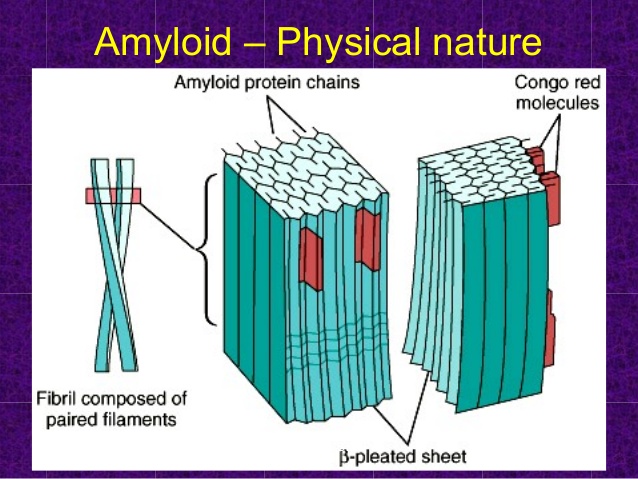
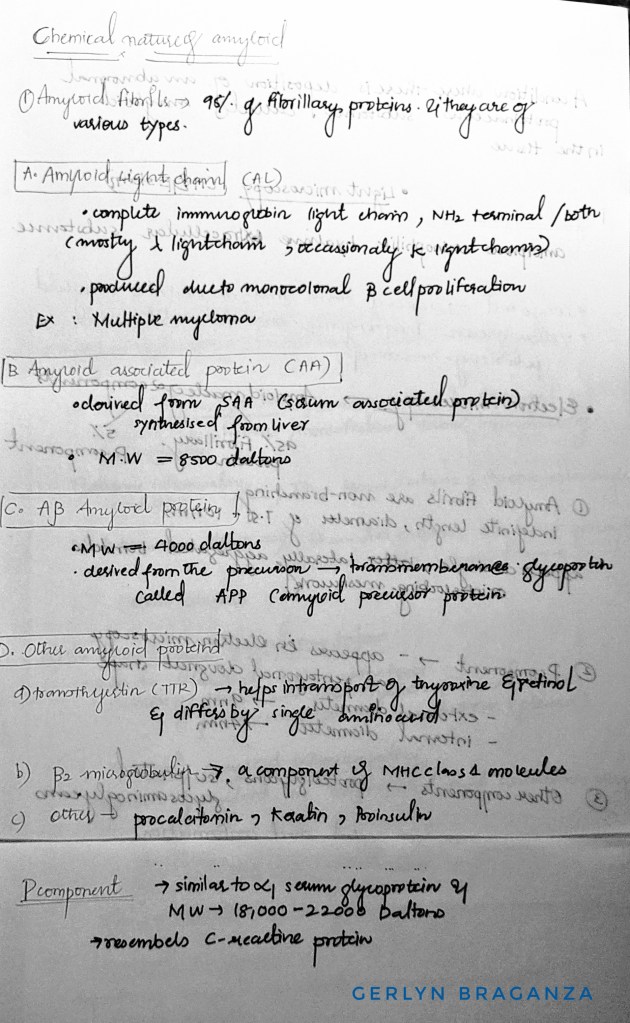
CHEMICAL NATURE OF AMYLOIDOSIS
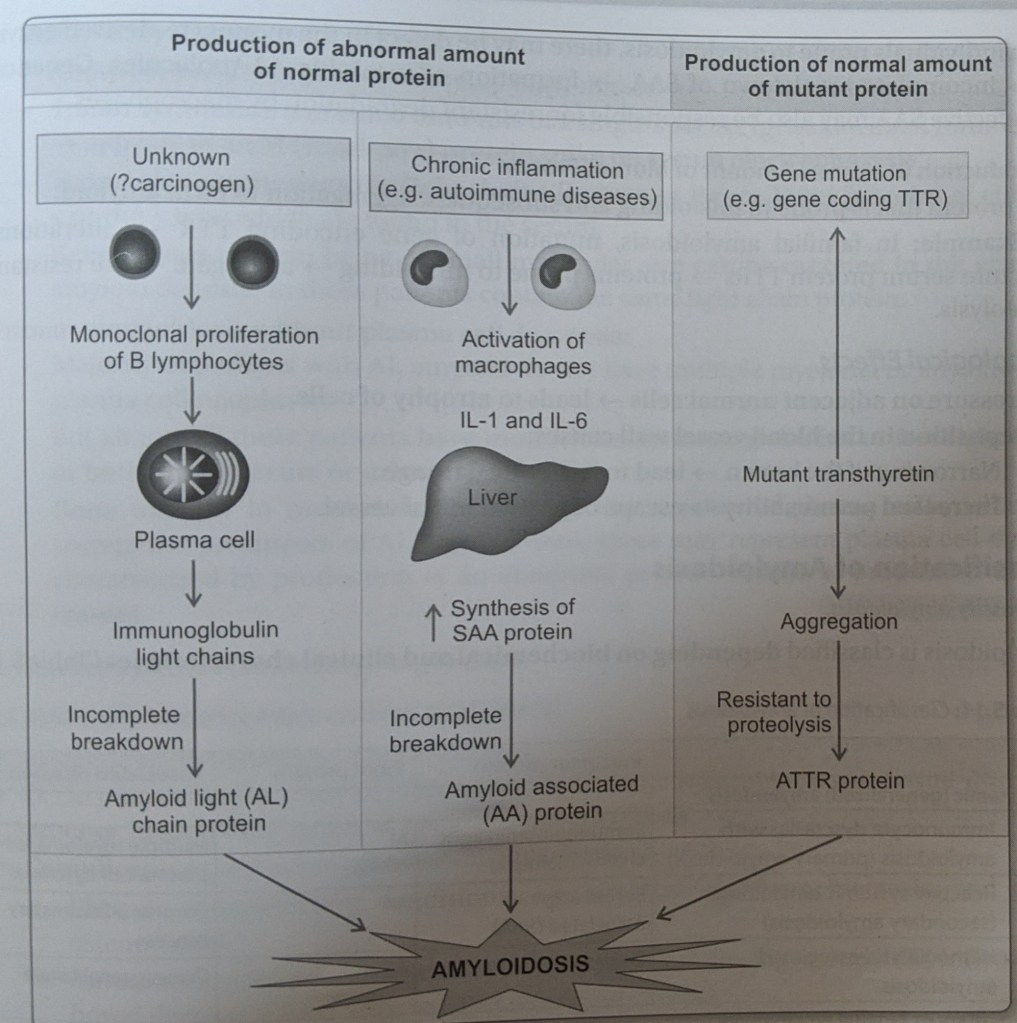
PATHOGENESIS –
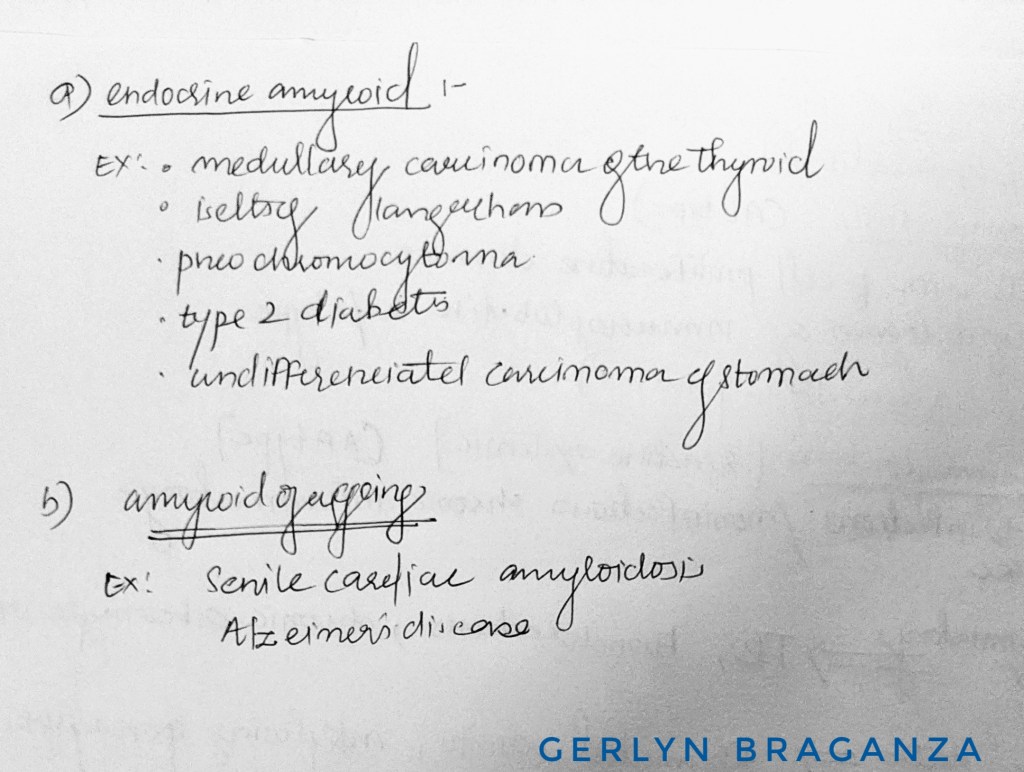
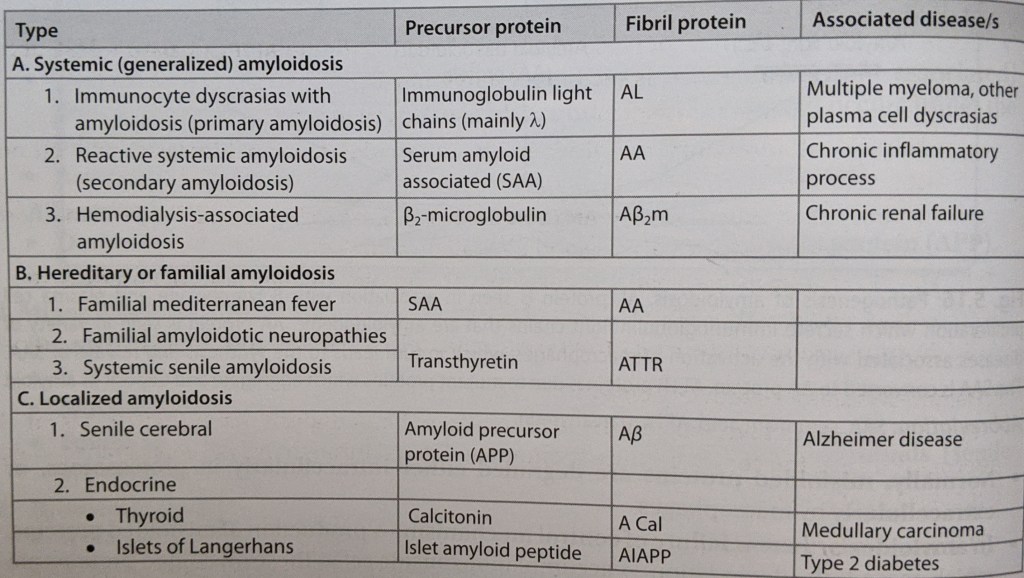
CLASSIFICATION OF AMYLOIDOSIS
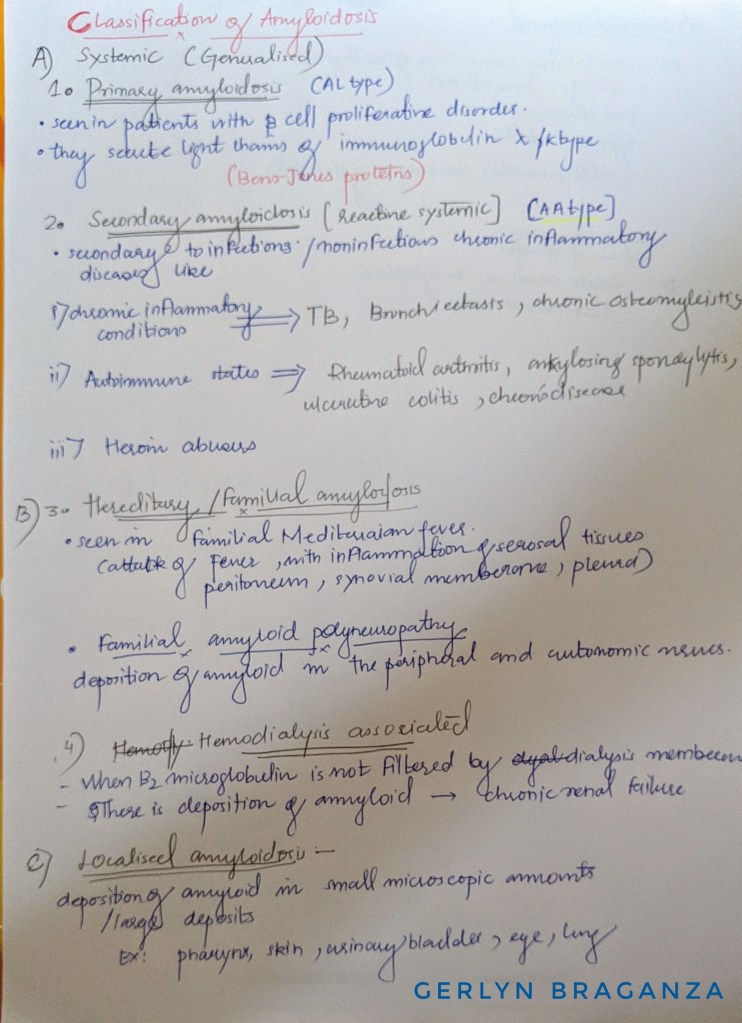
Main organs involved-
Secondary amyloidosis– kidneys , liver, spleen, lymph nodes, adrenals , thyroid
Primary amyloidosis– heart , skin , peripheral nerves, tongue, respiratory tract
Source – textbook of pathology ( harsh mohan ) and pathology preparatory manual by ramdas nayak
Pictures – Google
Also called thyrotoxicosis .
Hyperthyroidism is caused due to to hyposecretion of thyroid hormones like thyroxin, triiodothyronin and calcitonin .
Systemic changes seen-
1. In the metabolism: increase metabolic rate (BMR)
•lipid – decrease in cholesterol and triglycerides.
•carbohydrate – increase glycogenolysis and gluconeogenesis ( hyperglycemia)
•protein – wasting of muscle and negative nitrogen balance
2. CVS- increase in heart rate , stroke volume , cardiac output
decrease in the peripheral vascular resistance
Angina , arrhythmias and cardiac failure
3. CNS – Nervousness and anxiety
4. Musculoskeletal system – weakness, muscle fatigue , increased in deep tendon reflexes , osteoporosis and hypercalcaemia
5. GIT- increase in appetite and diarrhoea
6 . Reproductive system- menstrual irregularities and decrease in fertility
7. Eyes and face – lid retraction, periorbital edema and exophthalmos
8 . Skin and appendages – warm moist skin , heat intolerance and thin hair

What is thyrotoxic storm ?
Also called as thyroid storm.
Occurs due to very high levels of circulating thyroid hormones. Besides the usual features there is-
1.Hyperpyrexia
2. Nausea
3. Vomiting
4. Diarrhoea
5. Mental confusion
It’s precipitated by infection, trauma and surgery .
–
Propylthiouracil, iodides , propranolol, hydrocortisone
• local anaesthetic with adrenaline is avoided in hyperparathyroidism
SOURCE – Tara V Shanbhag |Smita Shenoy|Veena Nayak – pharmacology for dentistry
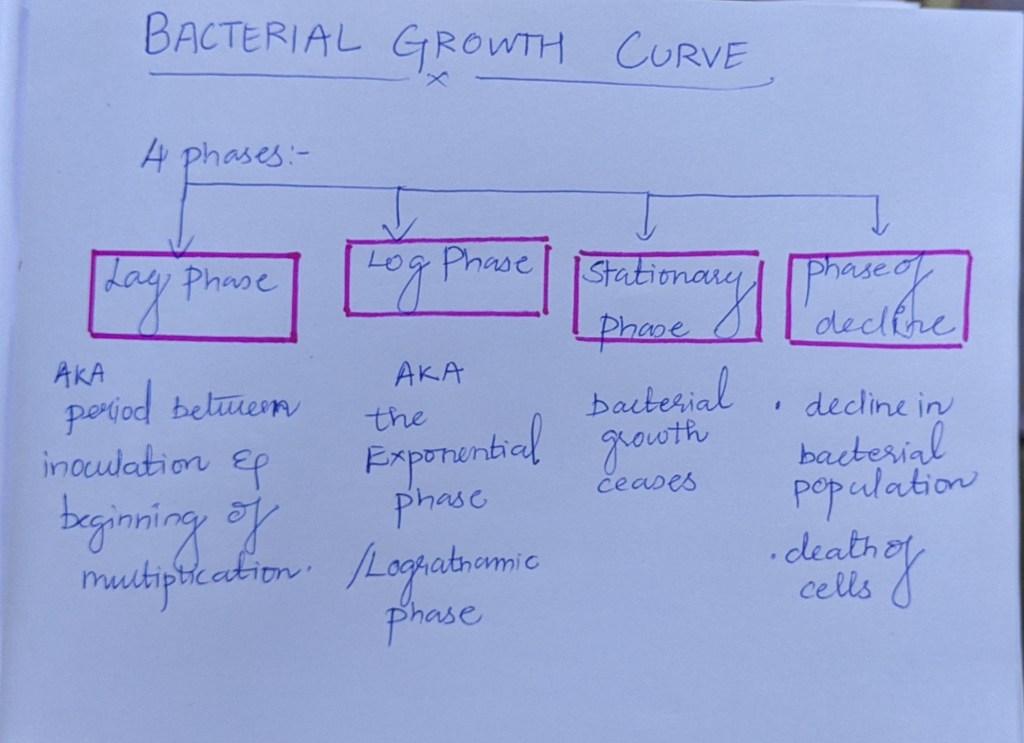
When a bacterium is inoculated into a suitable culture medium and is incubated, growth takes place and follows a definite course.
The bacterial growth count is plotted in relation to time , hence growth curve is obtained.
It has 4 phases .
1. Lag phase –
•after inoculation of culture medium multiplication does not begin immediately.
•the phase between inoculation and beginning of multiplication is called as lag phase
•in this phase organisms adapt to the new environment, in which necessary enzymes and intermediate metabolites are built up .
2. Log phase (exponential phase )
•in this phase cell division starts and the number increases exponentially or by geometric progression.
3. Stationary phase
•bacterial growth ceases almost completely.
•almost complete exhaustion of nutrients and accumulation of toxic products takes place.
•the number of viable cells here remain stationary.
Also there is almost a balance between dying cells and the new formed cells.
4. Phase of decline
• the bacterial population decreases due to death of cells.
•the decline phase starts due to exhaustion of nutrients and accumulation of toxic products and autolytic enzymes.
Decline takes place in the viable count and not the total count.
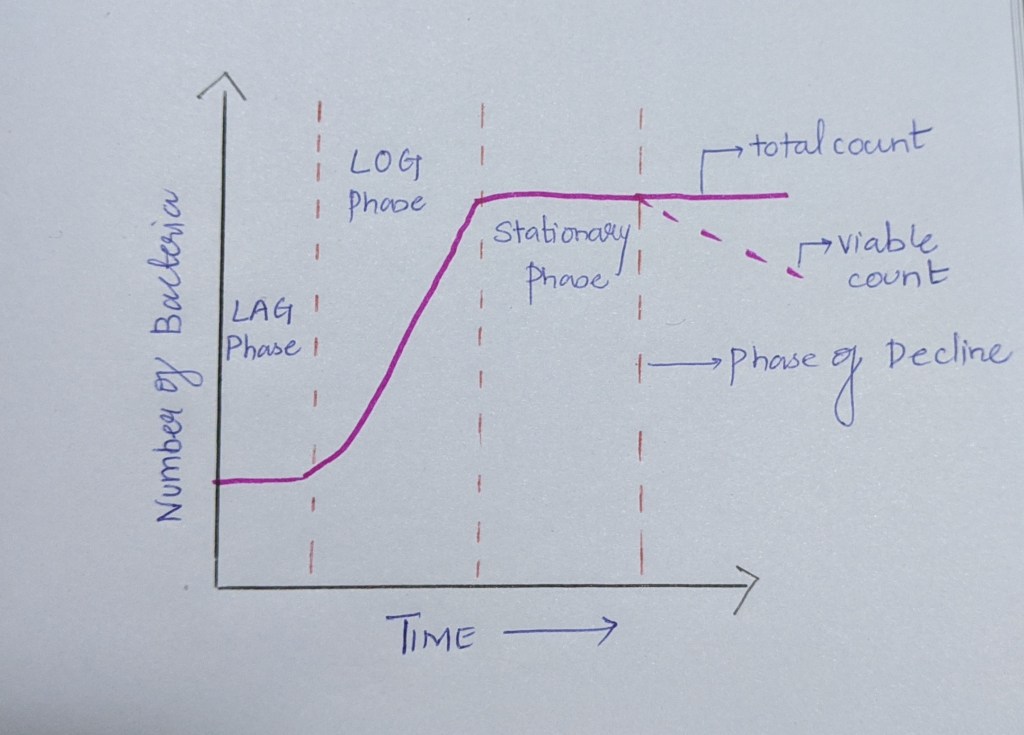
It’s of two types
1. Total count- indicates total number of bacteria present in the specimen, irrespective of living or dead.
2. Viable count- number of living cells.
Source – C P Baveja ( textbook of microbiology for dental students)

Source – textbook of pathology by ramdas nayak and harsh mohan
