SOURCE – Nancy Carolina 13th edition
Category: Uncategorized
Ideal Photographs ( extra oral)
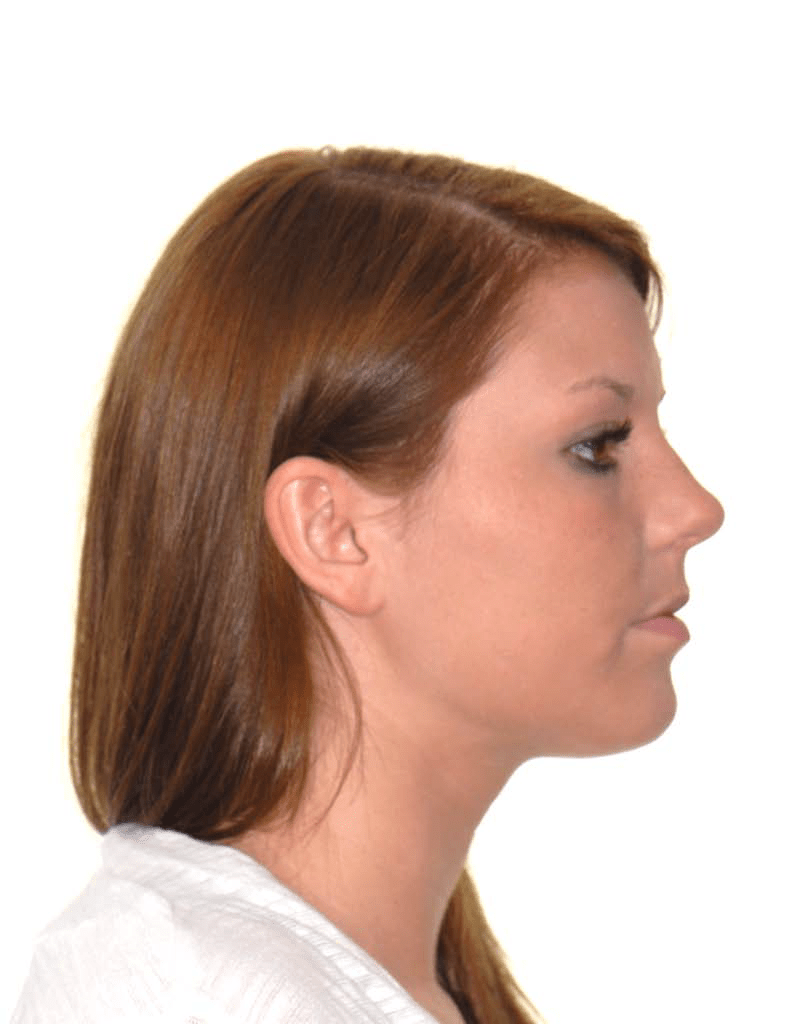
Teeth in occlusion
Lips relaxed and in contact
Natural head position with eyes looking forward
Entire head and neck displayed
Left eyelash slightly visible
Approximate center of frame is 1.0 cm anterior to tragus
White, or light, background

Eyes are open and looking into camera
Ears exposed
No distracting eyewear or jewelry
Inter-pupillary line horizontal to the frame
Approximate center of frame is the tip of the nos

Use the same format as the non-smiling frontal photograph adding a natural smile (social smile)
(ABO Photos)
P.S: It’s very important to improve photography skills. Final year students and graduated students must learn it now as it’s not only important for data recording but also required in marketing of your practice. Next time i will be sharing intra oral photographs. But one thing should be kept in mind, it is only learnt with practicing and interaction. So if you have any query you are most welcome. Thanks
Dr. Jawad Shah
PGR ortho
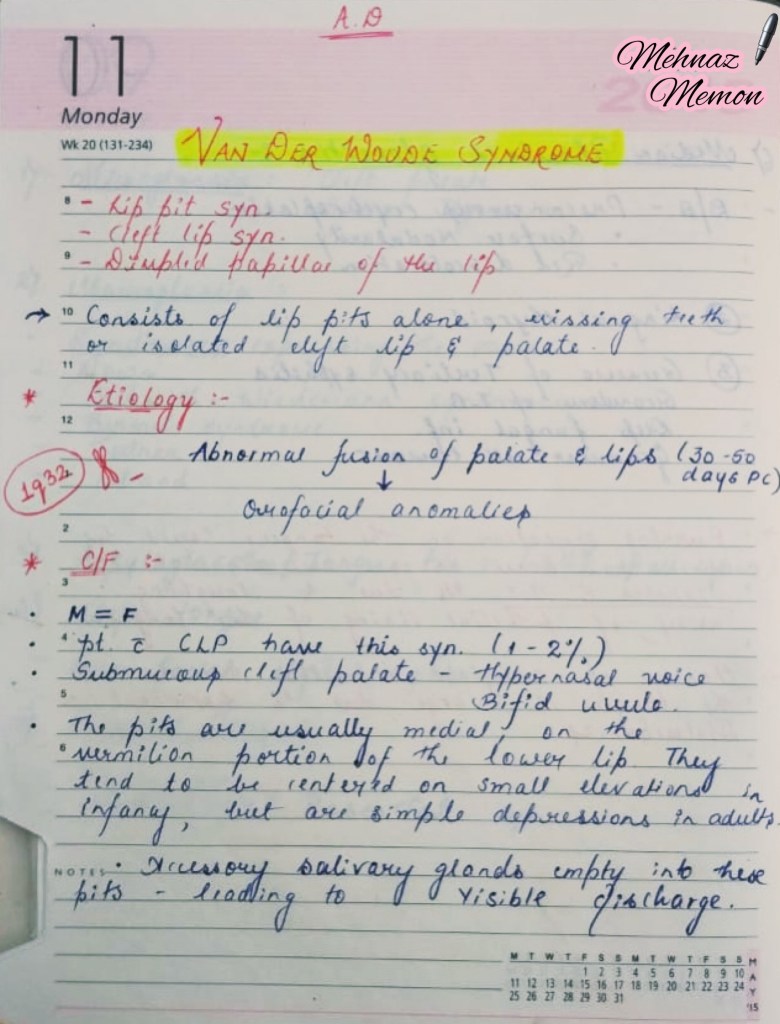
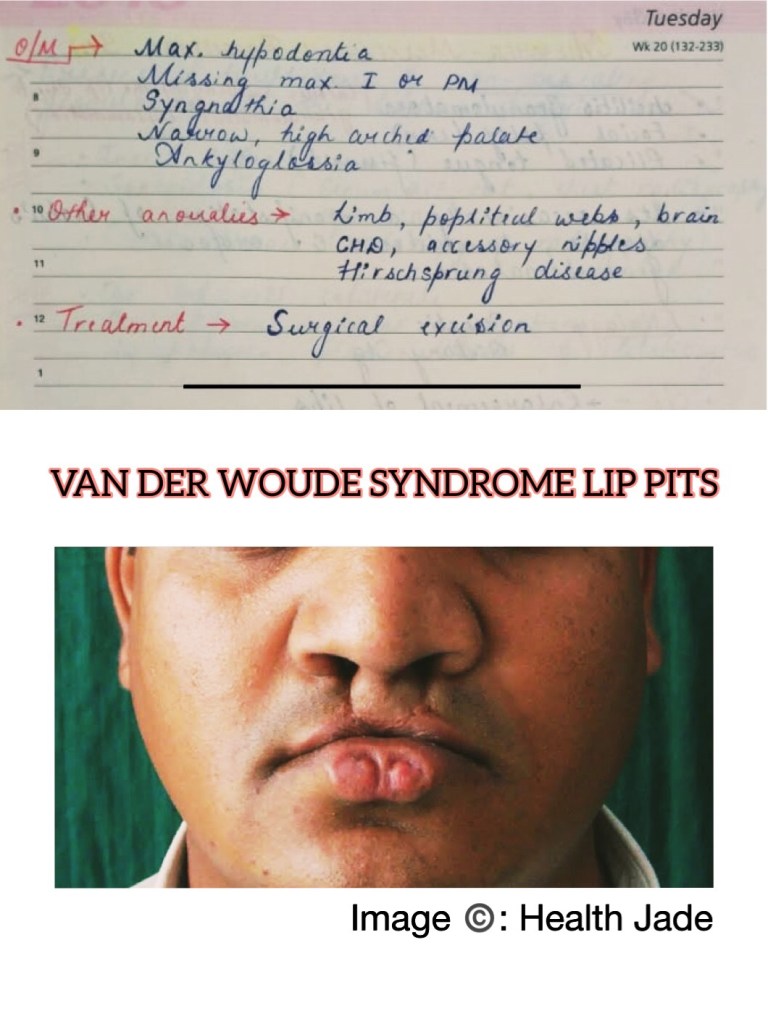
VAN DER WOUDE SYNDROME
References: Shafers Textbook Of Oral Pathology 7Ed
FUNCTIONAl MATRICES II
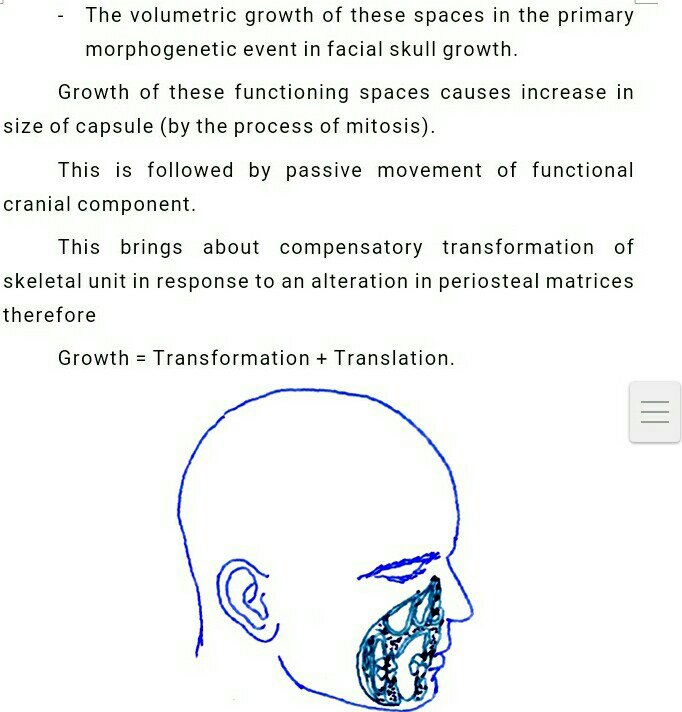
Written by – Sanjana Agrawal
SOURCE – GURKEERAT TEXTBOOK
DIFFERENCE BETWEEN CARDIOVERSION AND DEFIBRILLATION

SOURCE – Nancy Carolina 13th edition
OSSEOUS DEFECTS

source – do not remember had written it long back
ROUTES OF DRUG ADMINISTRATION


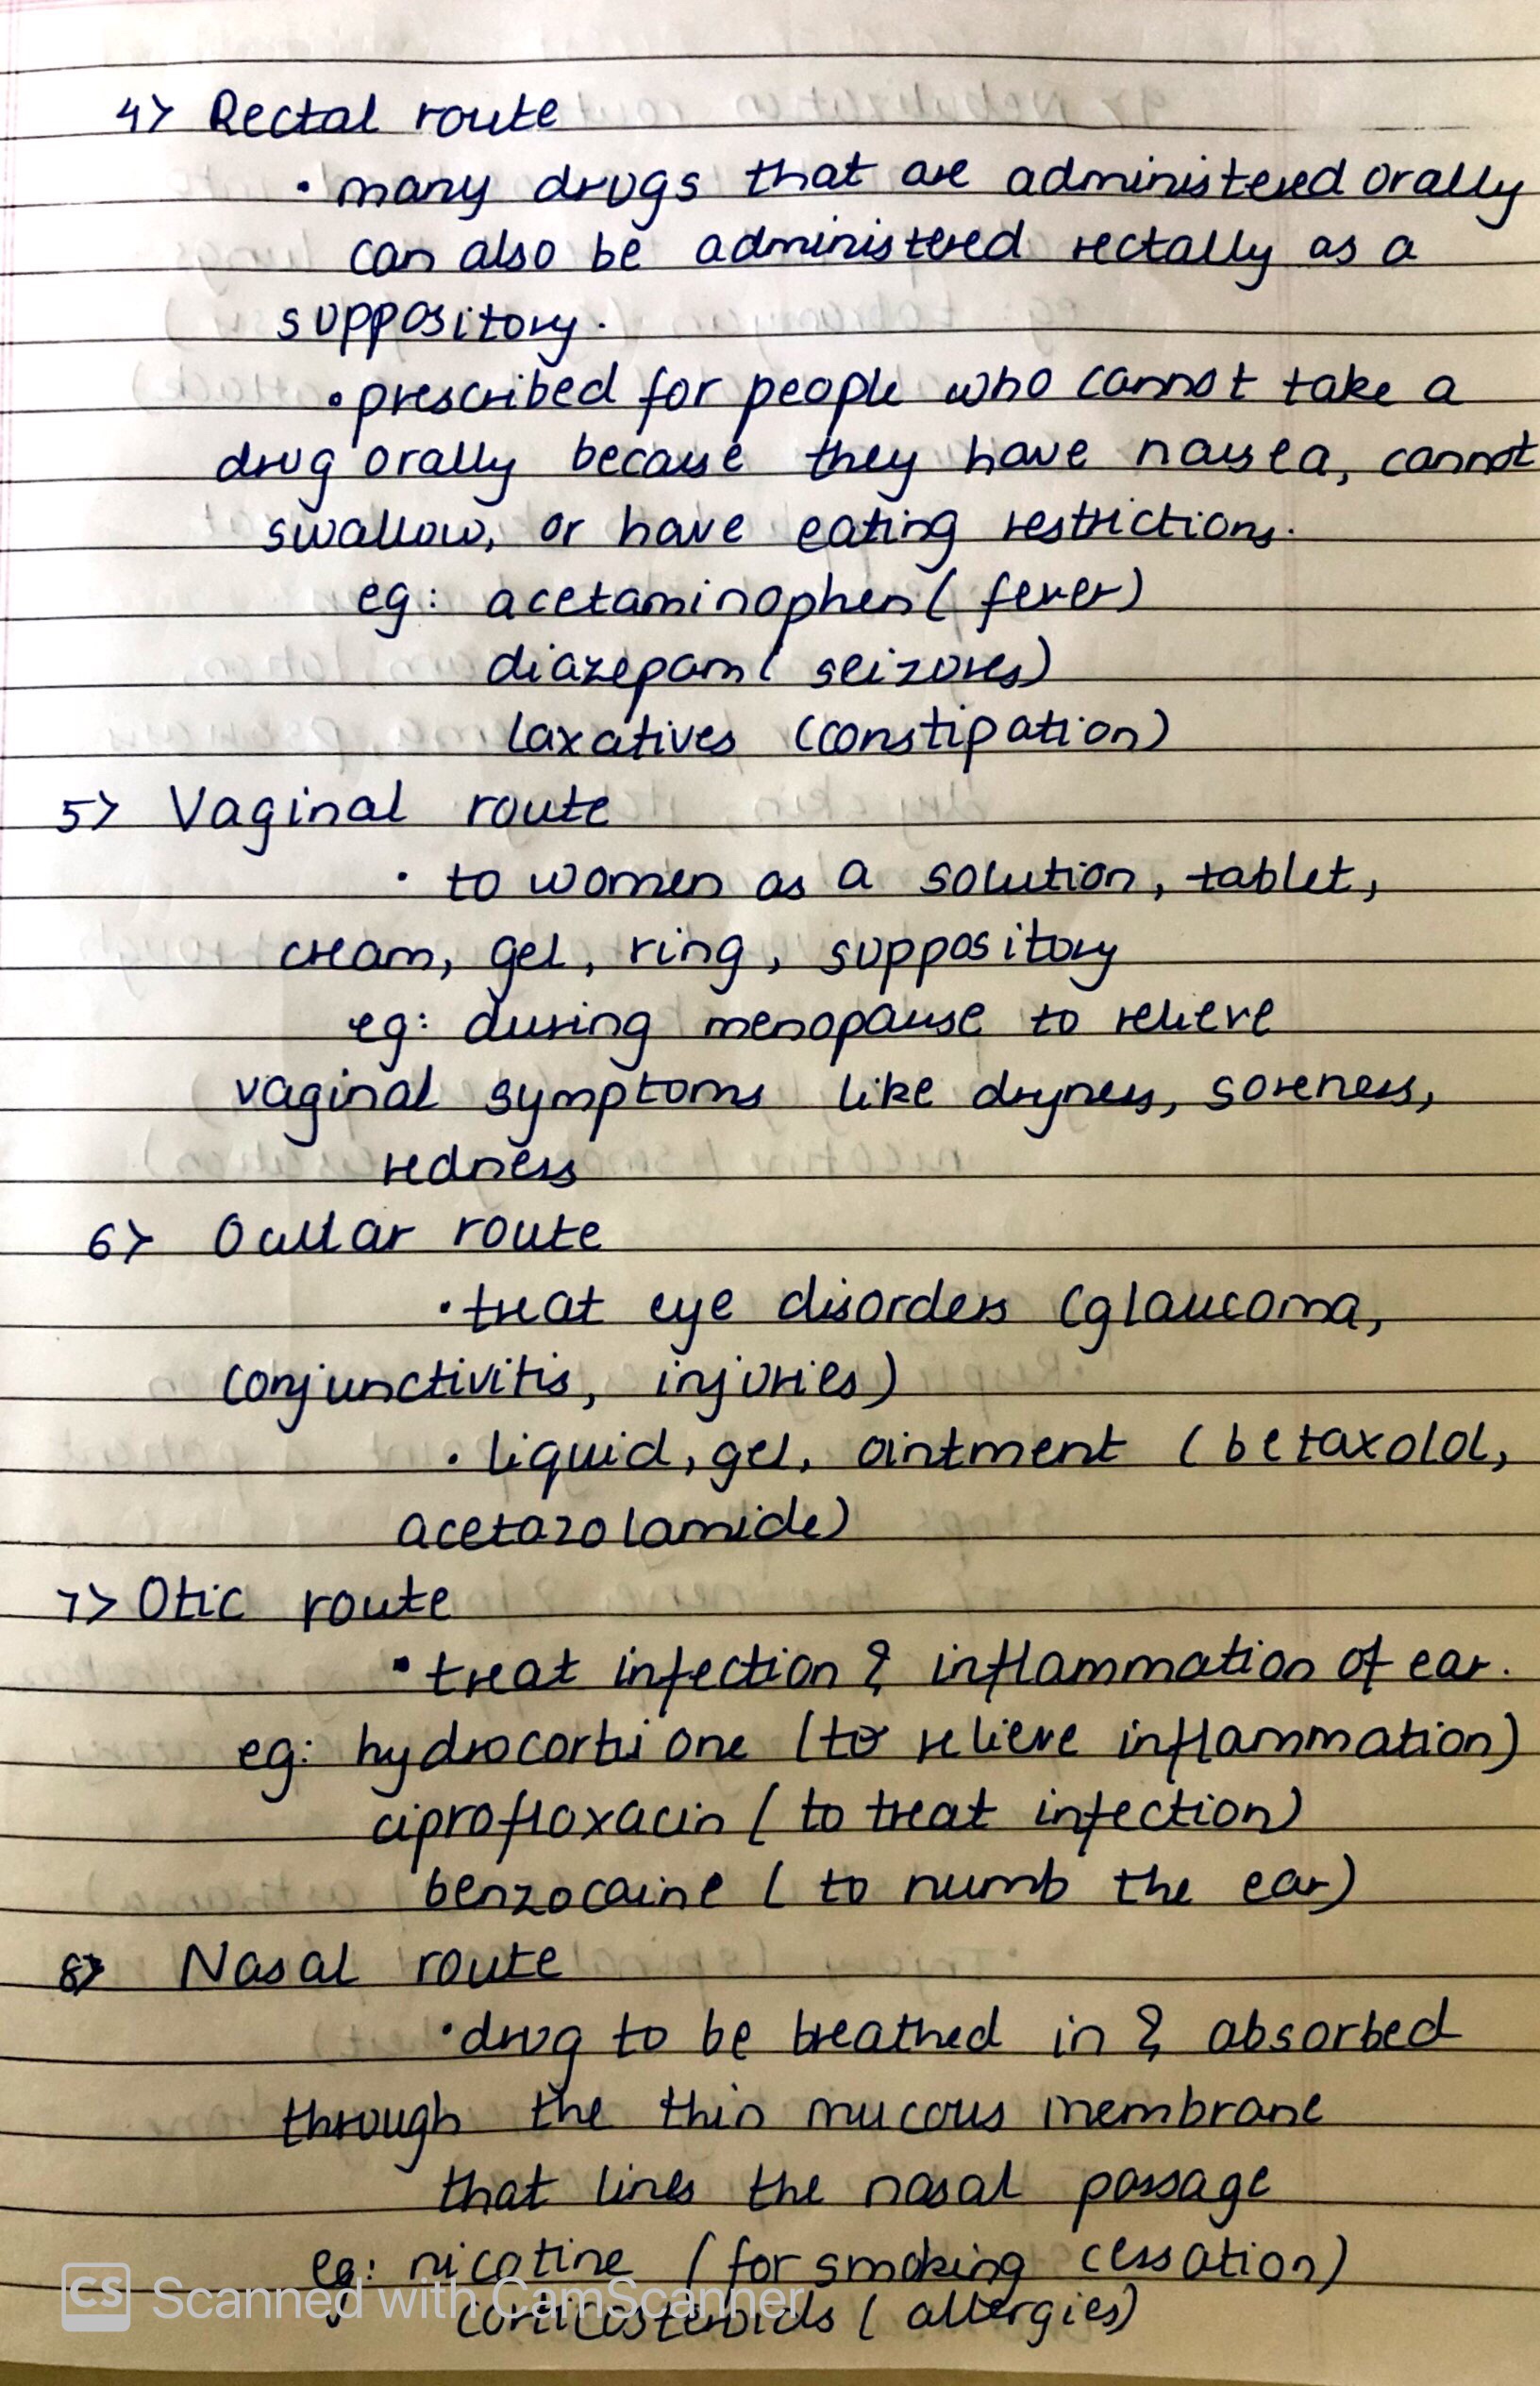

SOURCE – Nancy Carolina 13th edition
DIFFERENCE BETWEEN OXYGENATION AND VENTILATION
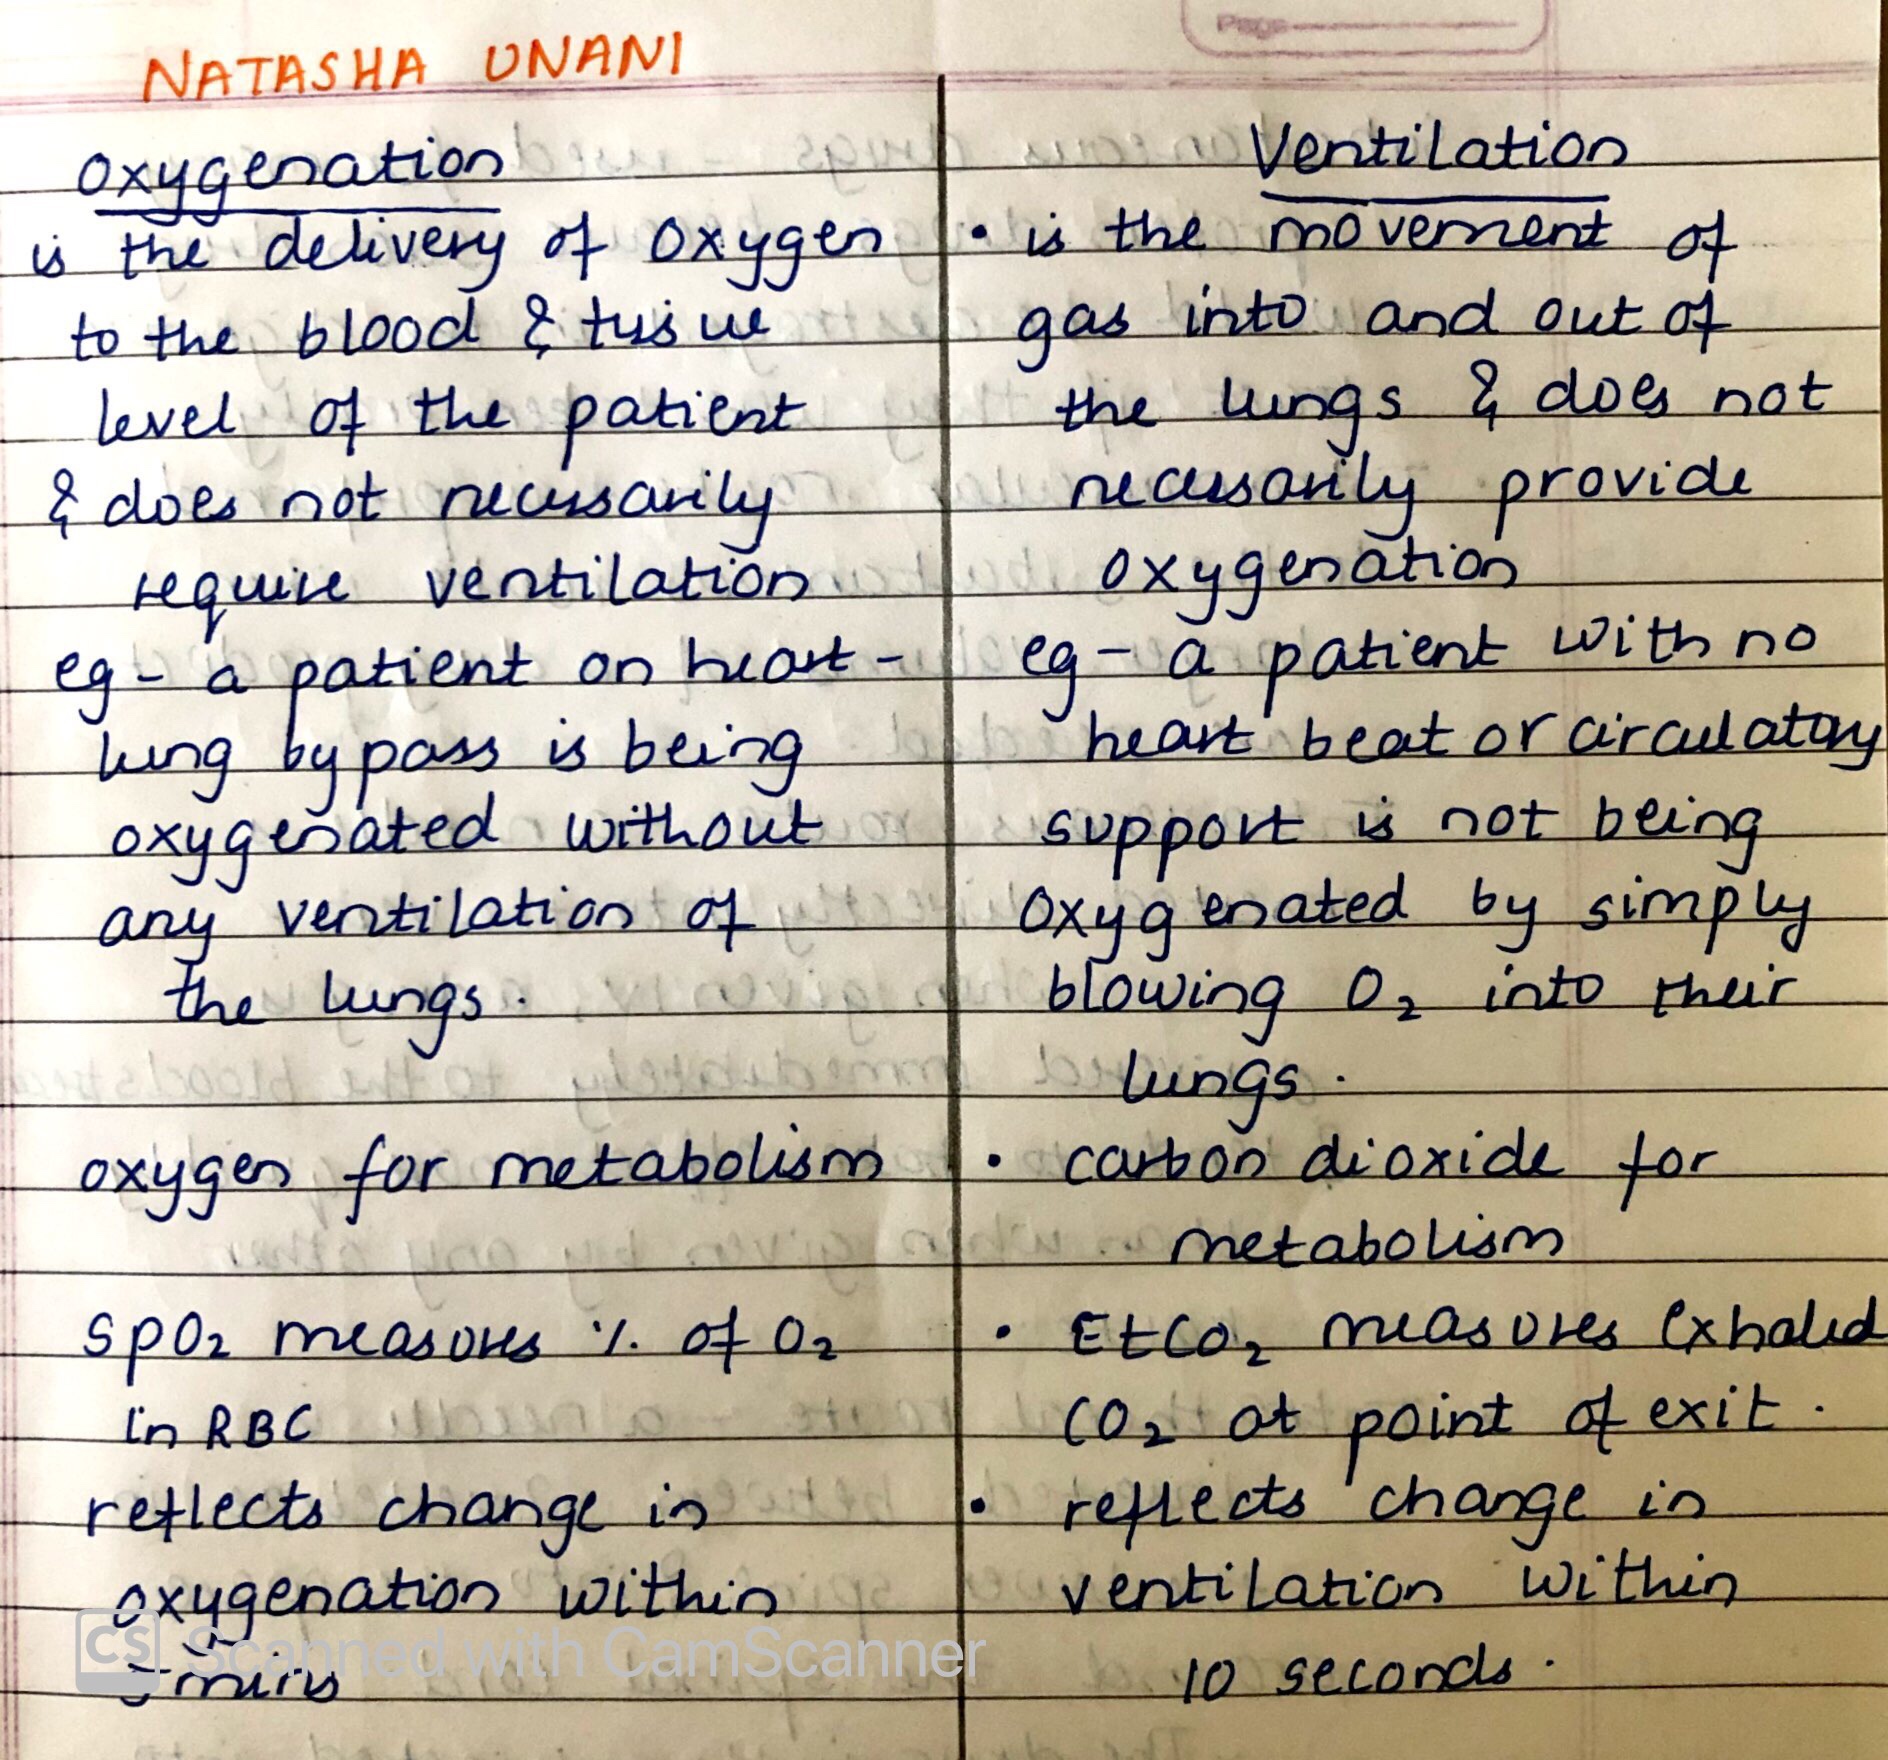
source – don’t remember had written it long back
Nausea and Vomitting
Nausea ,vomitting are common go to side effects of a drug, when external examiner asks during viva of a medical student. But, these symptoms can reveal many underlying conditions and diseases apart from the side effects of many drugs.
Nausea is imminent desire to vomit and often precedes or accompanies vomitting. vomiting is the forceful expulsion of the gastric contents through mouth.
PATHOPHYSIOLOGY:
1. Activation of the CTZ ,sends the impulses to the vomiting centre in brainstem,
2. Gastric fundus and gastroesophageal sphincter relaxes inturn cause raise in intra-abdominal pressure increase,due to increase in abdominal and diaphragm muscle contraction causes the gastric contents to enter the oesophagus ,
3. Increased intra-thoracic pressure results in further movement of food material to mouth
4.Reflex elevation of the soft palate and closure of glottis protect the nasopharynx and trachea and completes the vomiting
Causes of vomiting:
  1. DRUGS:
              -Cancer chemotherapy
              -Antibiotics
              -Cardiac antiarrhythmics
              -Digoxin
              -Oral hypoglycemics
              -Oral contraceptives
2.Metabolic and endocrine causes:
               -Pregnancy
               -Uremia
               -Ketoacidosis
               -Thyroid and parathyroid disease.
               -Adrenal insufficiency
3.Toxins:
              -Liver failure
              -Ethanol
4.Labyrinthine disease
             - Motion sickness
             - Labyrinthitis
             - Malignancy
5. Bowel obstructing disorder
6. Cardiopulmonary disorders and cardiomyopathies
7.Enteric infections
      -viral
      -Bacterial
8.Inflammatory dieases.
      - cholecystitis.
      -Pancreatitis
      -Appendicitis
      -Hepatitis.
9.Intracerebral disorders
      -Intracerebral disorders
      -Malignancy
      -Abscess
      -Hydrocephalus
10. Post operative vomiting
11.Impaired motor functions.
Careful clinical examination, will reveal the underlying
 cause for nausea and vomiting, like ,vomiting that occurs
 predominantly in the morning is often seen in pregnancy,
 uremia, and alcoholic gastritis;projectile vomiting suggests
 increased intracranial pressure,vomiting during or shortly
 after a meal may be due to psychogenic causes or peptic
 ulcer disease.
complications, can be Rupture of the esophagus,hematemesis
from a mucosal tear,dehydration, malnutrition, dental caries
and erosions, metabolic alkalosis, hypokalemia,
and aspiration pneumonitis.
Treatment is mainly based on the treatment of the underlying cause,
  -Antihistamines such as meclizine and dimenhydrinate are effective
for nausea due to inner ear dysfunction
  -Anticholinergics such as scopolamine are effective for nausea
   associated with motion sickness
  -Haloperidol and phenothiazine derivatives such as
    prochlorperazine are often effective in controlling mild nausea
    and vomiting, but sedation, hypotension, and parkinsonian
    symptoms are common side effects.
  -Metoclopramide may be superior to the phenothiazines in treating
   severe nausea and vomiting.IV metoclopramide may be effective
   as prophylaxis against nausea when given before chemotherapy.
  -Ondansetron and granisetron, serotonin receptor blockers,
   and glucocorticoids are used for treating nausea and vomiting
    associated with cancer chemotherapy.
  -Aprepitant, a neurokinin receptor blocker, is effective at
    controlling nausea from highly emetic drugs like cisplatin
Electrocardiogram (ECG)
Reflects and records the electrical activity of the heart muscle; details regarding the physiology of electrical conduction are addressed elsewhere.
The movement of action potentials through cardiac muscle cells produces extracellular signals that the ECG records.
A typical ECG comprises the following:
Waves, which are visible as movement above or below baseline voltage.
— A typical ECG comprises 5 waves, labeled P, Q, R, S, and T.
Segments represent time spent at baseline.
Intervals include both segments and waves.
— For example, the ST interval includes the distance encompassing the ST segment and the T wave.
Key electrochemistry definitions:
Depolarization occurs when the membrane potential becomes more positive.
Repolarization occurs when the membrane potential returns to negative.
– Recall that the normal resting potential of ventricular cardiac cells is approximately -90 millivolts.
Normal conduction pathway of electrical signals through the heart:
- Sinoatrial (SA) node is the pacemaker of the heart; it sets the heart’s rhythm.
— It sends electrical signals throughout the atria, and to the atrioventricular (AV) node. - The AV node then transmits the signal to the bundle of His(aka, AV bundle).
- From here, signals travel through the right and left bundle branches to the apex of the heart.
- The Purkinje fiber network spreads the electrical signals throughout the cardiac muscle cells of the ventricles.
Notice that this arrangement ensures that ventricular depolarization and subsequent contraction begins at the apex and moves towards the atria; this pathway moves blood out of the ventricles, whereas depolarization and contraction that began at the AV node, for example, would only squeeze blood to the bottom of the ventricles!
Idealized ECG recording of the electrical events of a single cardiac cycle:
- The horizontal axis tracks time from 0 to 1.4 seconds.
- The vertical axis tracks voltage from -0.6 to 1 millivolt.
P wave
- At 0.2 seconds, a small positive “wave”
— Reflects the period of atrial depolarization; atrial contractionoccurs during the latter part of the P wave.
QRS Complex
- Peaks at 0.4 seconds.
— Reflects the period of ventricular depolarization; a wide QRS complex indicates impaired conduction within the ventricles, as in bundle branch block.
— Obscures atrial repolarization.
T wave
- Wider and taller than the P wave.
— Reflects the period of ventricular repolarization.
Electrical and mechanical details:
- The sinoatrial node fires just before the P wave; the ECG does not record this event, but recall that the SA node is the pacemaker, and sends the electrical signals that initiate the P wave.
- The PR interval begins at the start of the P wave and ends at the start of the QRS complex.
— The PR segment is a sub-set of this interval, and encompasses the time between the end of the P wave and the onset of the QRS complex.
— Within the PR interval, the AV node fires, sending the electrical signal through the bundle of His, bundle branches, and to the Purkinje fibers (notice that this occurs specifically during the PR segment.).
— The duration of the PR interval is clinically important; PR intervals lasting longer than 0.12 – 0.20 seconds may indicate AV conduction block, which we learn about elsewhere. - The ST segment begins after the QRS complex and ends at the onset to the T wave.
— Ventricular contraction begins during the QRS complex and continues through the ST segment
– More specifically, isovolumetric contraction begins during the QRS complex, and the ST segment reflects the period of ventricular ejection of blood into the great vessels (see a portion of a Wigger’s Diagram). - Occasionally, an additional wave, the U wave, will appear after the T wave.
Clinical correlations
- A prominent U wave may reflect bradycardia (slow heart rate), hypokalemia, ischemia, or effects of antiarrhythmic drugs.
- The ECG can be used to determine heart rate:
— Calculate the PP interval, which is the distance between P waves of successive cardiac cycles, or the RR interval, which is the distance between successive R waves.
Misc. Info
Be aware that, unlike in action potential graphs, the shape of the wave does not indicate depolarization or repolarization – notice that both the P wave and T wave are positive (rise above the baseline), but the P wave reflects depolarization and the T wave reflects repolarization. This is because the ECG only shows the direction of current flow relative to the lead’s axis.
