IgA

Immunoglobulin A (IgA)

(i) IgA is the second major serum immunoglobulin (about 10-13% of serum normal serum immunoglobulins). The concentration is 0.6 – 4.2 mg/ml.

(ii) Half life is about 6 – 8 days.

(iii) IgA occurs in two forms, serum IgA and secretory IgA.

(iv) Serum IgA is a monomeric 7S molecule (MW 160,000)

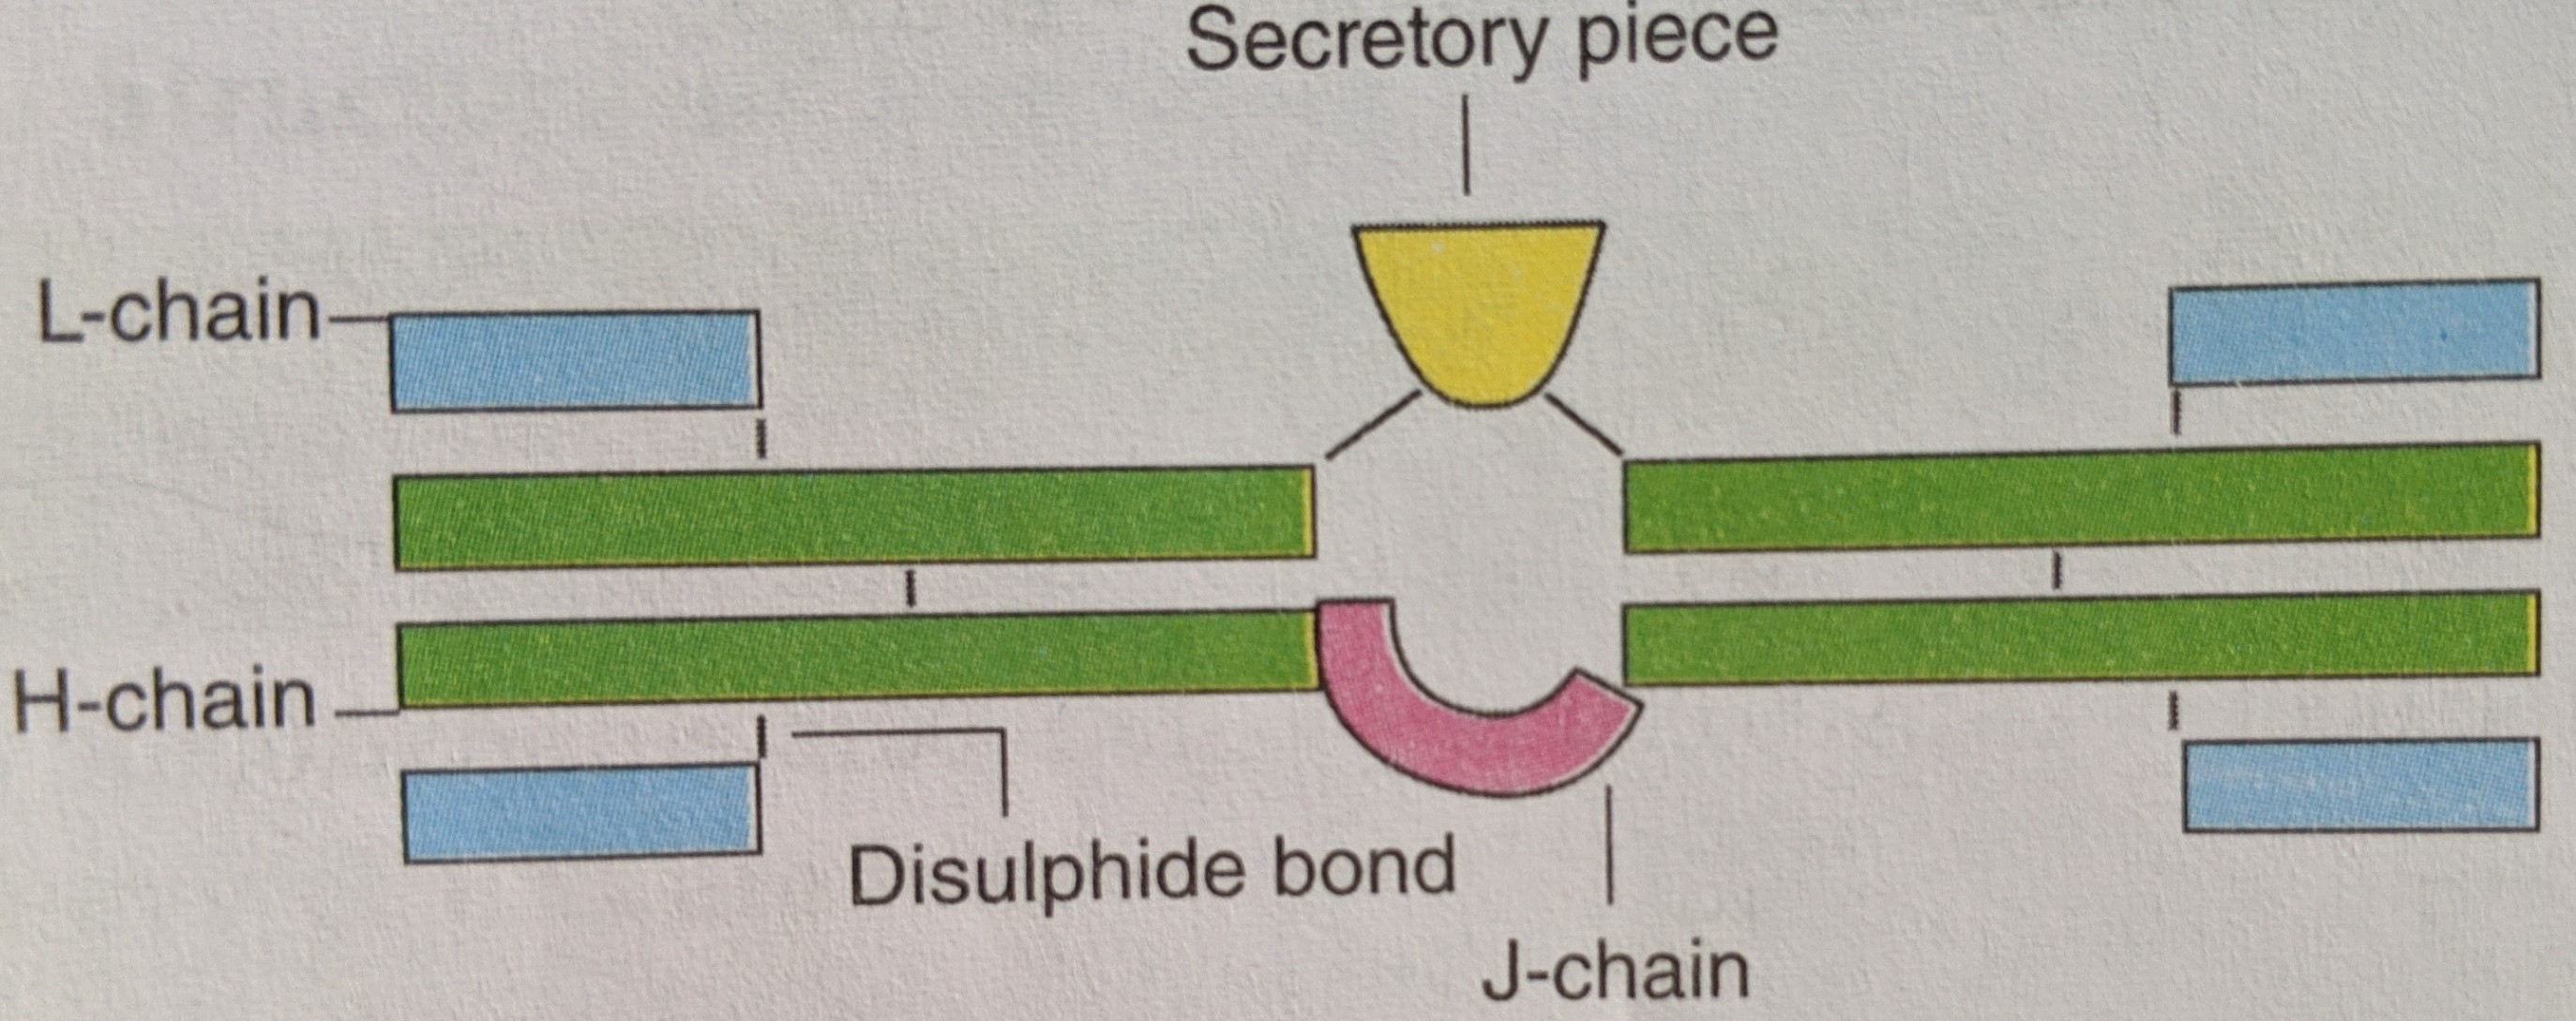
while IgA found on mucosal surfaces and in secretions (secretory IgA, MW 400,000) is a dimer formed by two monomer units joined together by a glycoprotein named J chain ( J for joining).

(v) Secretory IgA contains another polypeptide called the secretory piece or secretory component.

The S piece is believed to protect IgA from denaturation by bacterial proteases in sites such as the intestinal mucosa which is rich in bacterial flora.

(vi) IgA is the principle immunoglobulin present in secretions such as milk, saliva, tears, sweat, nasal fluids, colostrum and in secretions of respiratory, intestinal and genital systems.

It protects the mucous membranes against microorganisms.

(vii) IgA is mainly synthesised locally by plasma cells and little is derived from serum.

Source – textbook of microbiology C P Baveja

BACTERIAL GROWTH CURVE

When a bacterium is inoculated into a suitable culture medium and is incubated, growth takes place and follows a definite course.

The bacterial growth count is plotted in relation to time , hence growth curve is obtained.

It has 4 phases .

  1. Lag phase
  2. Log phase / exponential phase
  3. Stationary phase
  4. Phase of decline

So let’s know what are these phases

1. Lag phase –

•after inoculation of culture medium multiplication does not begin immediately.

the phase between inoculation and beginning of multiplication is called as lag phase

•in this phase organisms adapt to the new environment, in which necessary enzymes and intermediate metabolites are built up .

2. Log phase (exponential phase )

•in this phase cell division starts and the number increases exponentially or by geometric progression.

3. Stationary phase

•bacterial growth ceases almost completely.

•almost complete exhaustion of nutrients and accumulation of toxic products takes place.

•the number of viable cells here remain stationary.

Also there is almost a balance between dying cells and the new formed cells.

4. Phase of decline

• the bacterial population decreases due to death of cells.

•the decline phase starts due to exhaustion of nutrients and accumulation of toxic products and autolytic enzymes.

Decline takes place in the viable count and not the total count.

THE BACTERIAL GROWTH CURVE

bacterial count-

It’s of two types

1. Total count- indicates total number of bacteria present in the specimen, irrespective of living or dead.

2. Viable count- number of living cells.

To summarise it

Source – C P Baveja ( textbook of microbiology for dental students)